SOM cluster: 167
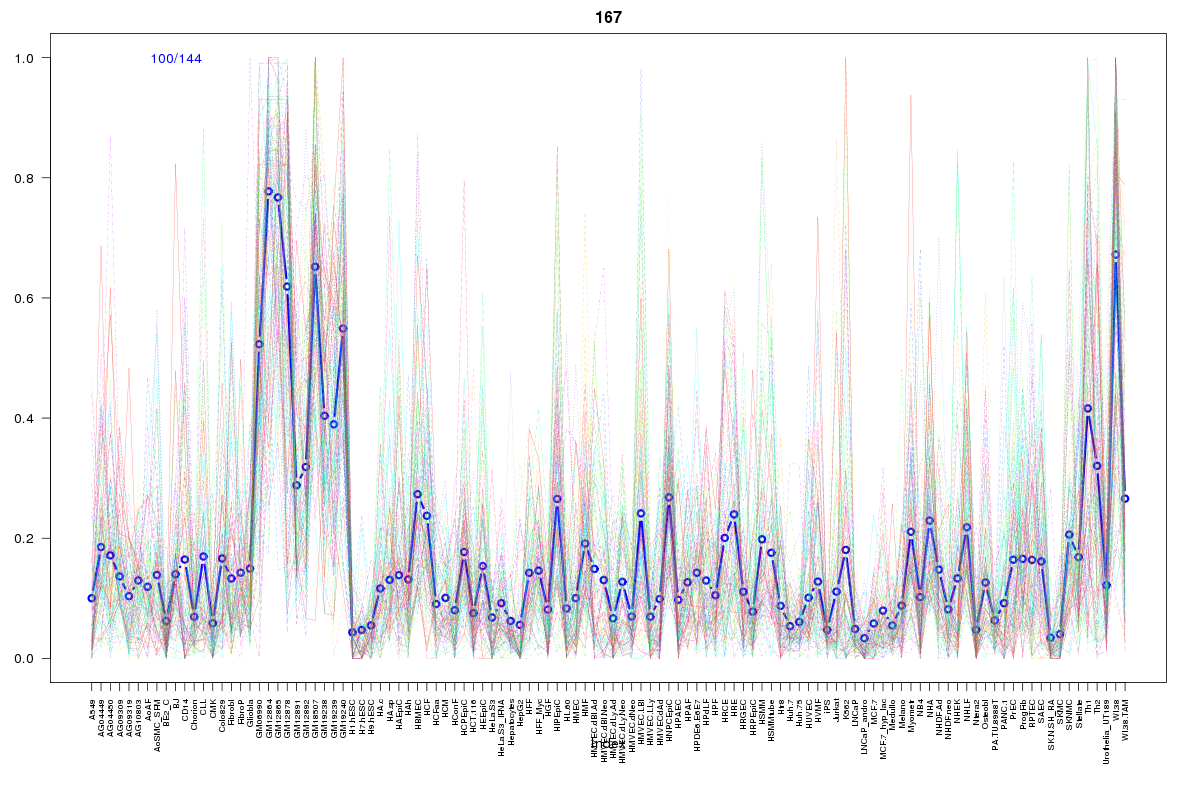
Cluster Hypersensitivity Profile

Genomic Location Trend
These plots show the distribution of the DHS sites surrounding the Transcript Start Site of the nearest gene.
Stats
Number of sites: 144Promoter: 1%
CpG-Island: 0%
Conserved: 28%
Enriched Motifs & Matches
Match Detail: [Jaspar]
|
| ||
|---|---|---|
| Sites: 39/100 | e-val: 0.000047 | ||
| Factor | e-val(match) | DB |
| NFE2L2 | 0.00000000020947 | JASPAR |
| AP1 | 0.00000000031524 | JASPAR |
| NFE2L1::MafG | 0.000062252 | JASPAR |
| PBX1 | 0.0018299 | JASPAR |
| RXRA::VDR | 0.014401 | JASPAR |
|
| ||
| Sites: 25/100 | e-val: 0.00039 | ||
| Factor | e-val(match) | DB |
| IRF1 | 0.0000098344 | JASPAR |
| SOX10 | 0.00048597 | JASPAR |
| EWSR1-FLI1 | 0.0024989 | JASPAR |
| IRF2 | 0.0044371 | JASPAR |
| NFE2L2 | 0.017187 | JASPAR |
BED file downloads
Top 10 Example Regions
| Location | Gene Link | Dist. |
|---|---|---|
| chr13: 99133340-99133490 | FARP1-AS1 | 42.86 |
| chr19: 18949740-18949890 | CRTC1 | 60.47 |
| chr7: 116650540-116650690 | ST7 | 63.15 |
| chr7: 116650540-116650690 | ST7-AS1 | 63.15 |
| chr5: 150160040-150160190 | SMIM3 | 65.37 |
| chr8: 6311980-6312130 | ANGPT2 | 65.41 |
| chr10: 6178245-6178395 | IL2RA | 66.85 |
| chr8: 96127760-96127910 | PLEKHF2 | 68.92 |
| chr1: 45772180-45772330 | TESK2 | 69.01 |
| chr1: 45772180-45772330 | TOE1 | 69.01 |