SOM cluster: 1674
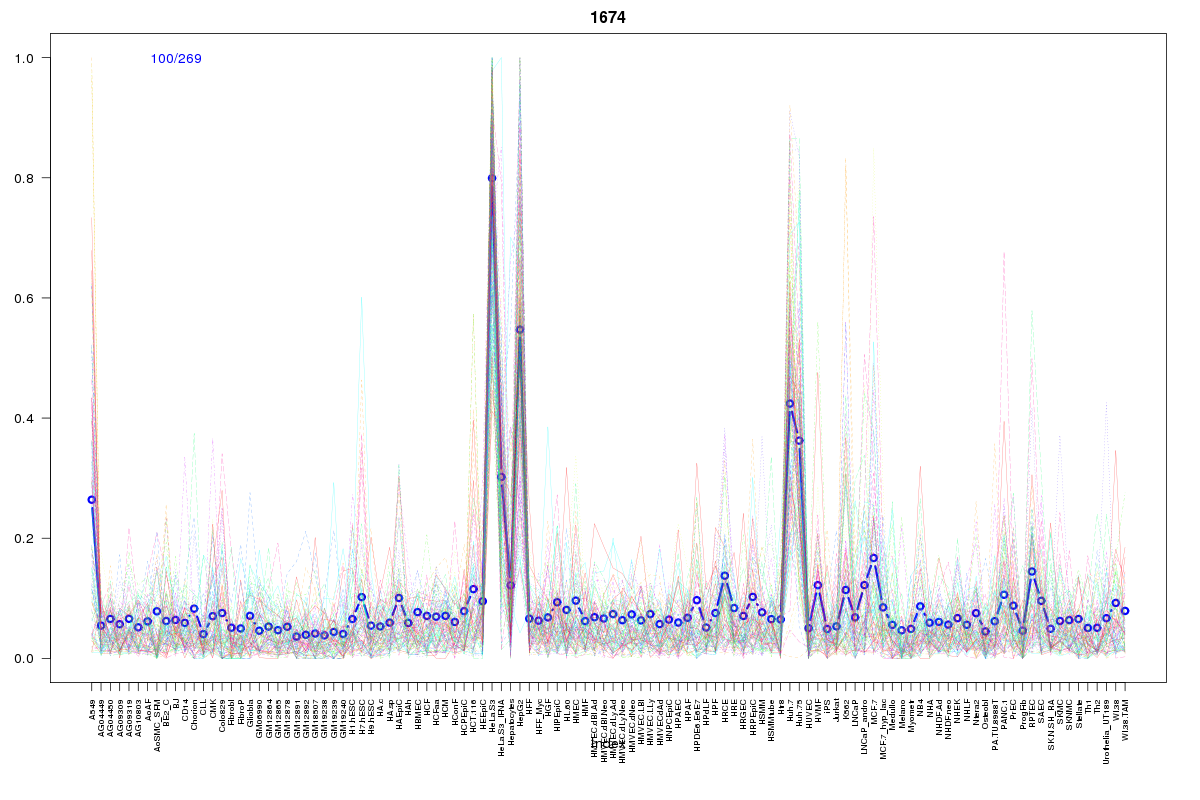
Cluster Hypersensitivity Profile

Genomic Location Trend
These plots show the distribution of the DHS sites surrounding the Transcript Start Site of the nearest gene.
Stats
Number of sites: 269Promoter: 7%
CpG-Island: 0%
Conserved: 34%
Enriched Motifs & Matches
Match Detail: [Jaspar]
|
| ||
|---|---|---|
| Sites: 22/100 | e-val: 0.25 | ||
| Factor | e-val(match) | DB |
| NR1H2::RXRA | 1.1102e-16 | JASPAR |
| PPARG::RXRA | 0.0000000000043795 | JASPAR |
| NR2F1 | 0.0000000000071346 | JASPAR |
| HNF4A | 0.000000000015647 | JASPAR |
| NR4A2 | 0.00000008026 | JASPAR |
BED file downloads
Top 10 Example Regions
| Location | Gene Link | Dist. |
|---|---|---|
| chr11: 47215460-47215610 | ACP2 | 39.04 |
| chr11: 47215460-47215610 | PACSIN3 | 39.04 |
| chr11: 47215460-47215610 | NR1H3 | 39.04 |
| chr11: 66627205-66627355 | LRFN4 | 42.72 |
| chr11: 66627205-66627355 | RCE1 | 42.72 |
| chr11: 66627205-66627355 | PC | 42.72 |
| chr17: 73575080-73575230 | SAP30BP | 52.9 |
| chr17: 73575080-73575230 | TSEN54 | 52.9 |
| chr5: 75768520-75768670 | RP11-156N15.1 | 53.15 |
| chr10: 104881220-104881370 | NT5C2 | 54.63 |