SOM cluster: 1677
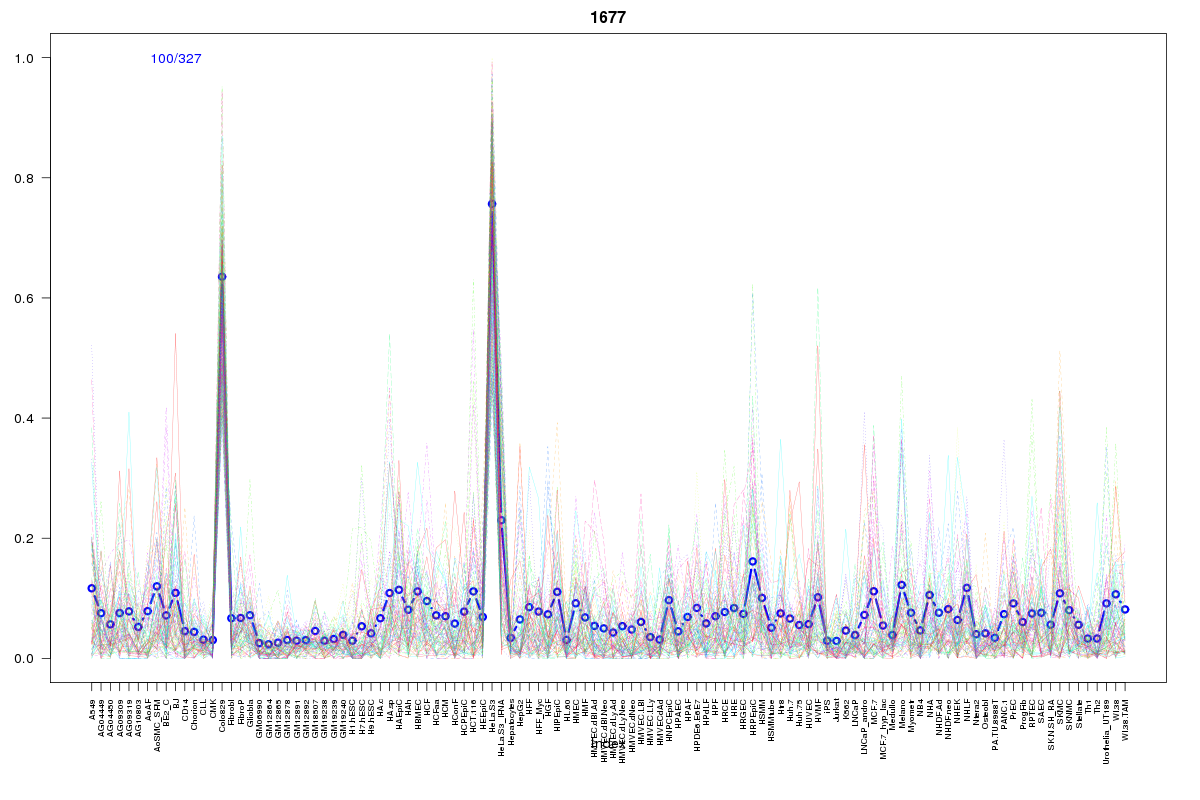
Cluster Hypersensitivity Profile

Genomic Location Trend
These plots show the distribution of the DHS sites surrounding the Transcript Start Site of the nearest gene.
Stats
Number of sites: 327Promoter: 2%
CpG-Island: 1%
Conserved: 39%
Enriched Motifs & Matches
Match Detail: [Jaspar]
|
| ||
|---|---|---|
| Sites: 41/100 | e-val: 0.000005 | ||
| Factor | e-val(match) | DB |
| Foxd3 | 0.00016046 | JASPAR |
| HNF1B | 0.00092407 | JASPAR |
| Foxq1 | 0.0015122 | JASPAR |
| ARID3A | 0.0031353 | JASPAR |
| NR3C1 | 0.0048129 | JASPAR |
BED file downloads
Top 10 Example Regions
| Location | Gene Link | Dist. |
|---|---|---|
| chr3: 31978820-31978970 | OSBPL10 | 30.82 |
| chr3: 15675440-15675590 | ANKRD28 | 47.77 |
| chr7: 134218220-134218370 | AKR1B1 | 52.07 |
| chr12: 24652480-24652630 | RP11-444D3.1 | 58.49 |
| chr7: 129916520-129916670 | CPA2 | 58.83 |
| chr7: 129916520-129916670 | TMEM209 | 58.83 |
| chr3: 37239945-37240095 | AC097359.2 | 62.69 |
| chr3: 37239945-37240095 | LRRFIP2 | 62.69 |
| chr3: 37239945-37240095 | GOLGA4 | 62.69 |
| chr3: 37239945-37240095 | UBE2FP1 | 62.69 |