SOM cluster: 1689
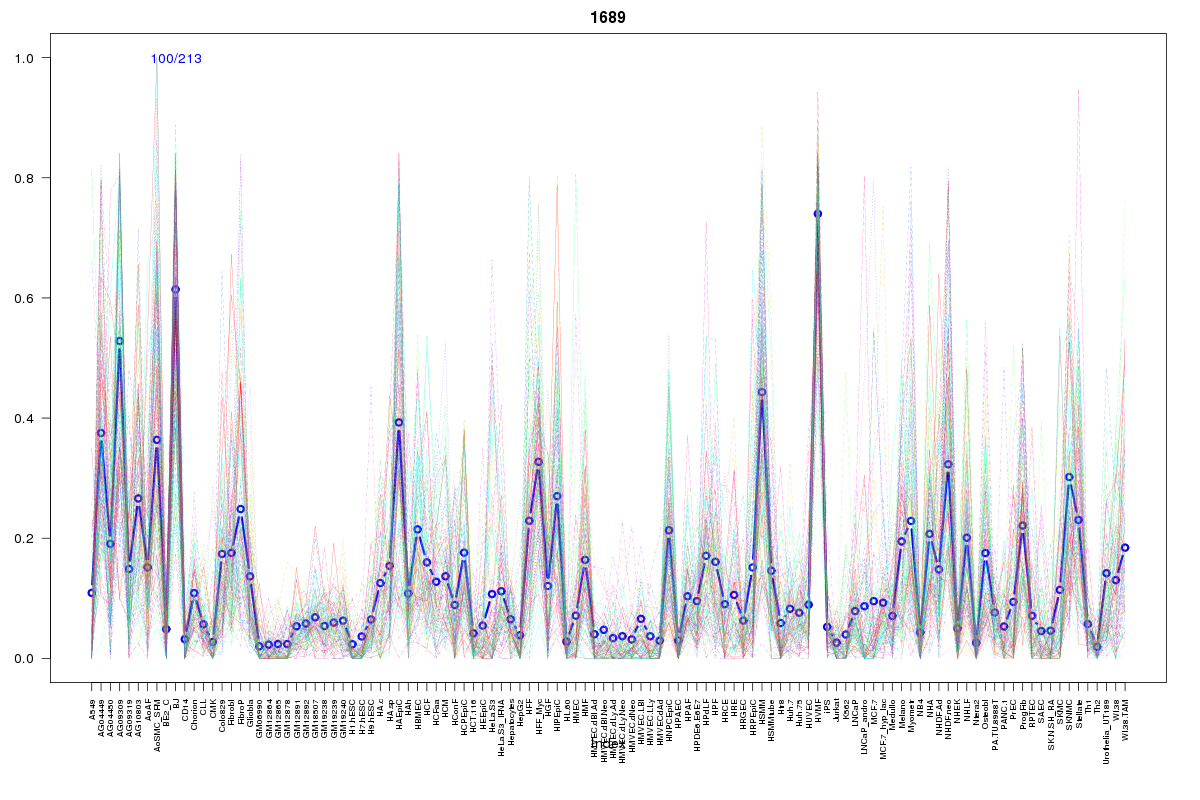
Cluster Hypersensitivity Profile

Genomic Location Trend
These plots show the distribution of the DHS sites surrounding the Transcript Start Site of the nearest gene.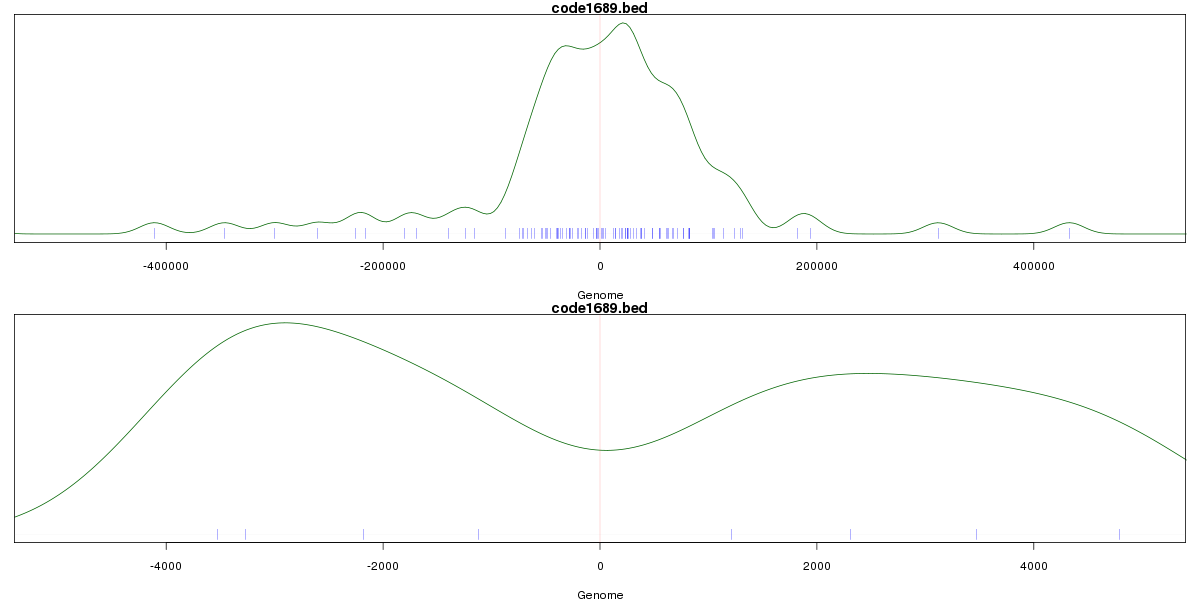
Stats
Number of sites: 213Promoter: 1%
CpG-Island: 0%
Conserved: 43%
Enriched Motifs & Matches
Match Detail: [Jaspar]
|
| ||
|---|---|---|
| Sites: 36/100 | e-val: 0.00000019 | ||
| Factor | e-val(match) | DB |
| NR3C1 | 0.00052766 | JASPAR |
| Foxq1 | 0.0019 | JASPAR |
| MEF2A | 0.0038818 | JASPAR |
| Foxd3 | 0.0052173 | JASPAR |
| Sox2 | 0.014263 | JASPAR |
BED file downloads
Top 10 Example Regions
| Location | Gene Link | Dist. |
|---|---|---|
| chr1: 90275240-90275390 | RP5-943J3.1 | 26.19 |
| chr1: 151515440-151515590 | TUFT1 | 29.05 |
| chr5: 110919120-110919270 | NREP | 52.39 |
| chr17: 12508660-12508810 | LINC00670 | 56.38 |
| chr8: 97250040-97250190 | UQCRB | 56.47 |
| chr17: 5069200-5069350 | ZNF232 | 64.36 |
| chr17: 5069200-5069350 | AC012146.7 | 64.36 |
| chr8: 134177880-134178030 | WISP1 | 66.87 |
| chr15: 93163080-93163230 | RP11-386M24.5 | 70.11 |
| chr8: 13115220-13115370 | DLC1 | 71.26 |