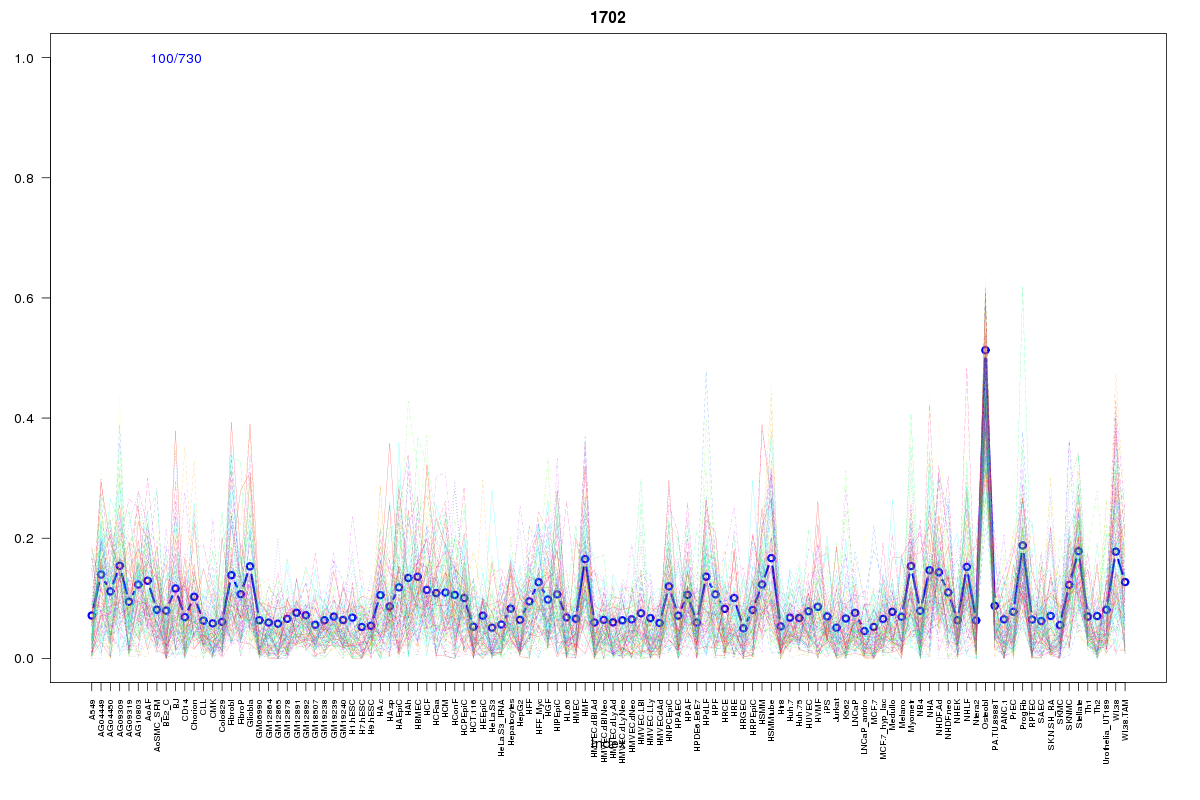
SOM cluster: 1702
Cluster Hypersensitivity Profile

Genomic Location Trend
These plots show the distribution of the DHS sites surrounding the Transcript Start Site of the nearest gene.
Stats
Number of sites: 730Promoter: 1%
CpG-Island: 1%
Conserved: 21%
Enriched Motifs & Matches
Match Detail: [Jaspar]
|
| ||
|---|---|---|
| Sites: 21/100 | e-val: 0.0092 | ||
| Factor | e-val(match) | DB |
| AP1 | 0.000000039023 | JASPAR |
| NFE2L2 | 0.0000058574 | JASPAR |
| SOX10 | 0.0017877 | JASPAR |
| ESR2 | 0.001892 | JASPAR |
| Sox17 | 0.0032701 | JASPAR |
BED file downloads
Top 10 Example Regions
| Location | Gene Link | Dist. |
|---|---|---|
| chr1: 147718365-147718515 | RP11-301M17.1 | 17.31 |
| chr3: 48630280-48630430 | UCN2 | 36.54 |
| chr3: 48630280-48630430 | SHISA5 | 36.54 |
| chr1: 94089080-94089230 | BCAR3 | 38.74 |
| chr7: 45073165-45073315 | SNORA5A | 46.96 |
| chr19: 56002565-56002715 | SSC5D | 47.43 |
| chr20: 32268445-32268595 | PXMP4 | 52.25 |
| chr1: 151285020-151285170 | PI4KB | 53.95 |
| chr22: 20242020-20242170 | LINC00896 | 55.12 |
| chr22: 20242020-20242170 | XXbac-B444P24.8 | 55.12 |