SOM cluster: 1709
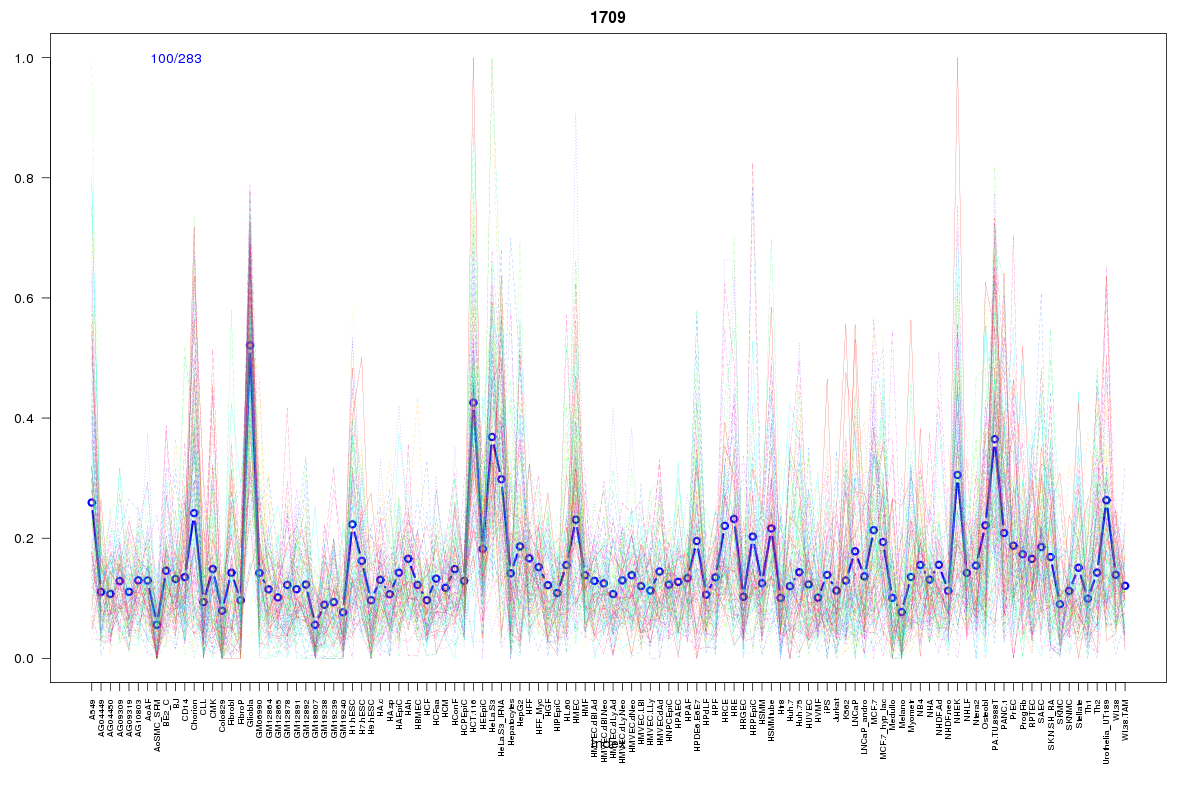
Cluster Hypersensitivity Profile

Genomic Location Trend
These plots show the distribution of the DHS sites surrounding the Transcript Start Site of the nearest gene.
Stats
Number of sites: 283Promoter: 16%
CpG-Island: 8%
Conserved: 34%
Enriched Motifs & Matches
Match Detail: [Jaspar]
|
| ||
|---|---|---|
| Sites: 71/100 | e-val: 8.1e-28 | ||
| Factor | e-val(match) | DB |
| SP1 | 0.00000000097976 | JASPAR |
| Klf4 | 0.000000022784 | JASPAR |
| Pax4 | 0.0037244 | JASPAR |
| Egr1 | 0.010525 | JASPAR |
| RREB1 | 0.014894 | JASPAR |
|
| ||
| Sites: 24/100 | e-val: 0.0014 | ||
| Factor | e-val(match) | DB |
| SP1 | 0.000098935 | JASPAR |
| Klf4 | 0.003991 | JASPAR |
| Hand1::Tcfe2a | 0.010459 | JASPAR |
| NFIC | 0.015562 | JASPAR |
| RREB1 | 0.040737 | JASPAR |
|
| ||
| Sites: 23/100 | e-val: 0.0035 | ||
| Factor | e-val(match) | DB |
| Pax4 | 0.000001782 | JASPAR |
| SP1 | 0.0000076696 | JASPAR |
| EWSR1-FLI1 | 0.000015705 | JASPAR |
| PLAG1 | 0.0003777 | JASPAR |
| PPARG::RXRA | 0.00071994 | JASPAR |
BED file downloads
Top 10 Example Regions
| Location | Gene Link | Dist. |
|---|---|---|
| chr11: 74935265-74935415 | ARRB1 | 25.41 |
| chr17: 18160905-18161055 | FLII | 39.71 |
| chr1: 203483445-203483595 | PRELP | 42.53 |
| chr4: 190643420-190643570 | RNU1-51P | 51.2 |
| chr8: 21985805-21985955 | DMTN | 51.54 |
| chr8: 21985805-21985955 | PHYHIP | 51.54 |
| chr1: 1280940-1281090 | DVL1 | 58.36 |
| chr17: 73872060-73872210 | UNK | 58.76 |
| chr17: 73872060-73872210 | TRIM47 | 58.76 |
| chr17: 73872060-73872210 | TRIM65 | 58.76 |