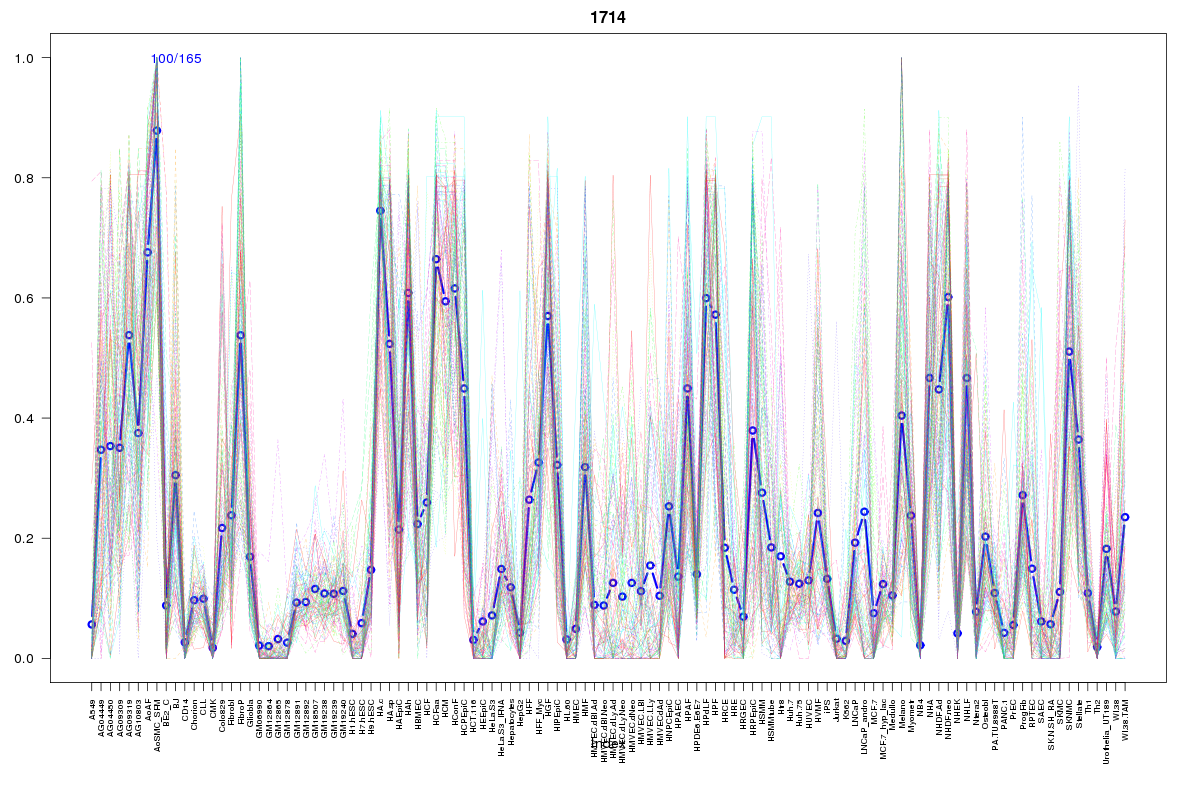
SOM cluster: 1714
Cluster Hypersensitivity Profile

Genomic Location Trend
These plots show the distribution of the DHS sites surrounding the Transcript Start Site of the nearest gene.
Stats
Number of sites: 165Promoter: 1%
CpG-Island: 0%
Conserved: 76%
Enriched Motifs & Matches
Match Detail: [Jaspar]
|
| ||
|---|---|---|
| Sites: 37/100 | e-val: 0.000024 | ||
| Factor | e-val(match) | DB |
| NFATC2 | 0.0000022764 | JASPAR |
| FOXO3 | 0.0015712 | JASPAR |
| TLX1::NFIC | 0.0028911 | JASPAR |
| Spz1 | 0.0036795 | JASPAR |
| NFIC | 0.0041488 | JASPAR |
|
| ||
| Sites: 14/100 | e-val: 0.28 | ||
| Factor | e-val(match) | DB |
| Pax4 | 0.0018233 | JASPAR |
| Foxd3 | 0.0022167 | JASPAR |
| NFATC2 | 0.0030174 | JASPAR |
| FOXI1 | 0.003898 | JASPAR |
| FOXO3 | 0.0050615 | JASPAR |
BED file downloads
Top 10 Example Regions
| Location | Gene Link | Dist. |
|---|---|---|
| chr8: 98924560-98924710 | MATN2 | 56.53 |
| chr4: 8396080-8396230 | TRMT44 | 58.04 |
| chr4: 8396080-8396230 | RP11-774O3.3 | 58.04 |
| chr17: 64720980-64721130 | PRKCA | 61.48 |
| chr12: 94821380-94821530 | CCDC41 | 62.83 |
| chr22: 40845780-40845930 | RP5-1042K10.10 | 64.8 |
| chr22: 40845780-40845930 | RP4-591N18.2 | 64.8 |
| chr1: 171050540-171050690 | RP5-1092L12.2 | 66.92 |
| chr1: 171050540-171050690 | MROH9 | 66.92 |
| chr1: 171050540-171050690 | FMO6P | 66.92 |