SOM cluster: 1720
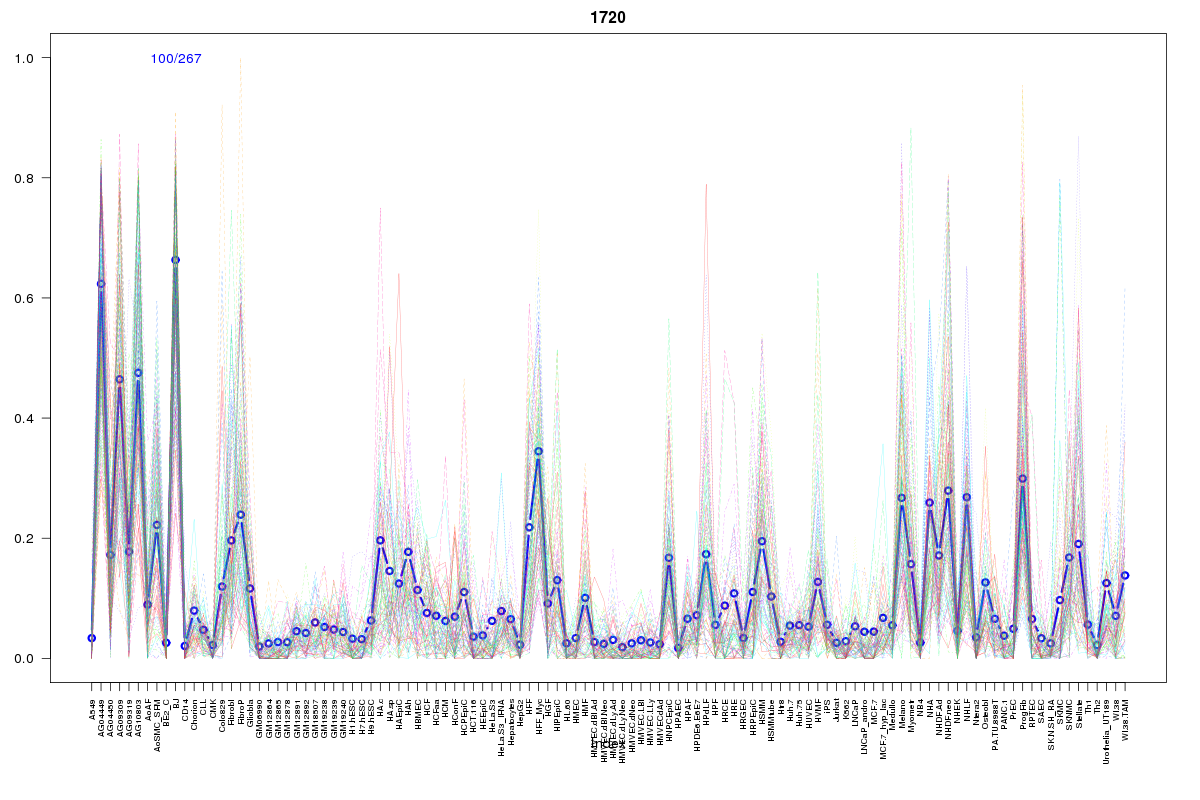
Cluster Hypersensitivity Profile

Genomic Location Trend
These plots show the distribution of the DHS sites surrounding the Transcript Start Site of the nearest gene.
Stats
Number of sites: 267Promoter: 1%
CpG-Island: 0%
Conserved: 33%
Enriched Motifs & Matches
Match Detail: [Jaspar]
|
| ||
|---|---|---|
| Sites: 42/100 | e-val: 0.0003 | ||
| Factor | e-val(match) | DB |
| Foxd3 | 0.000033419 | JASPAR |
| Lhx3 | 0.000083325 | JASPAR |
| HNF1A | 0.00015174 | JASPAR |
| Foxq1 | 0.00016267 | JASPAR |
| Foxa2 | 0.0010962 | JASPAR |
|
| ||
| Sites: 14/100 | e-val: 1 | ||
| Factor | e-val(match) | DB |
| TEAD1 | 0.000018616 | JASPAR |
| Lhx3 | 0.00057687 | JASPAR |
| EWSR1-FLI1 | 0.00080057 | JASPAR |
| Foxa2 | 0.0015359 | JASPAR |
| FOXO3 | 0.0023903 | JASPAR |
BED file downloads
Top 10 Example Regions
| Location | Gene Link | Dist. |
|---|---|---|
| chr7: 120975500-120975650 | WNT16 | 52.02 |
| chr7: 120975500-120975650 | CPED1 | 52.02 |
| chr12: 96040925-96041075 | NTN4 | 58.4 |
| chr12: 105812640-105812790 | C12orf75 | 59.57 |
| chr8: 70399740-70399890 | SULF1 | 66.55 |
| chr12: 5663880-5664030 | NTF3 | 67.05 |
| chr18: 9437260-9437410 | TWSG1 | 70.81 |
| chr2: 172325800-172325950 | METTL8 | 71.09 |
| chr6: 26106200-26106350 | HIST1H4E | 71.98 |
| chr6: 26106200-26106350 | HIST1H4D | 71.98 |