SOM cluster: 1728
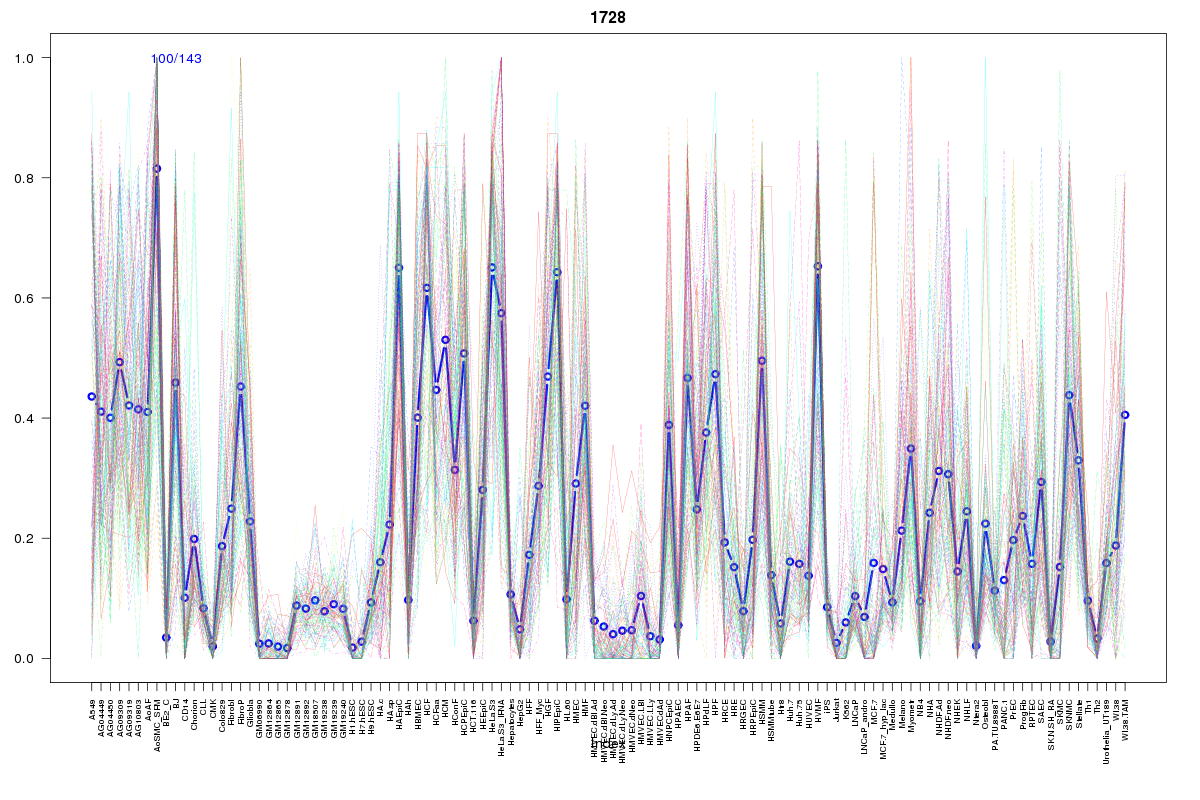
Cluster Hypersensitivity Profile

Genomic Location Trend
These plots show the distribution of the DHS sites surrounding the Transcript Start Site of the nearest gene.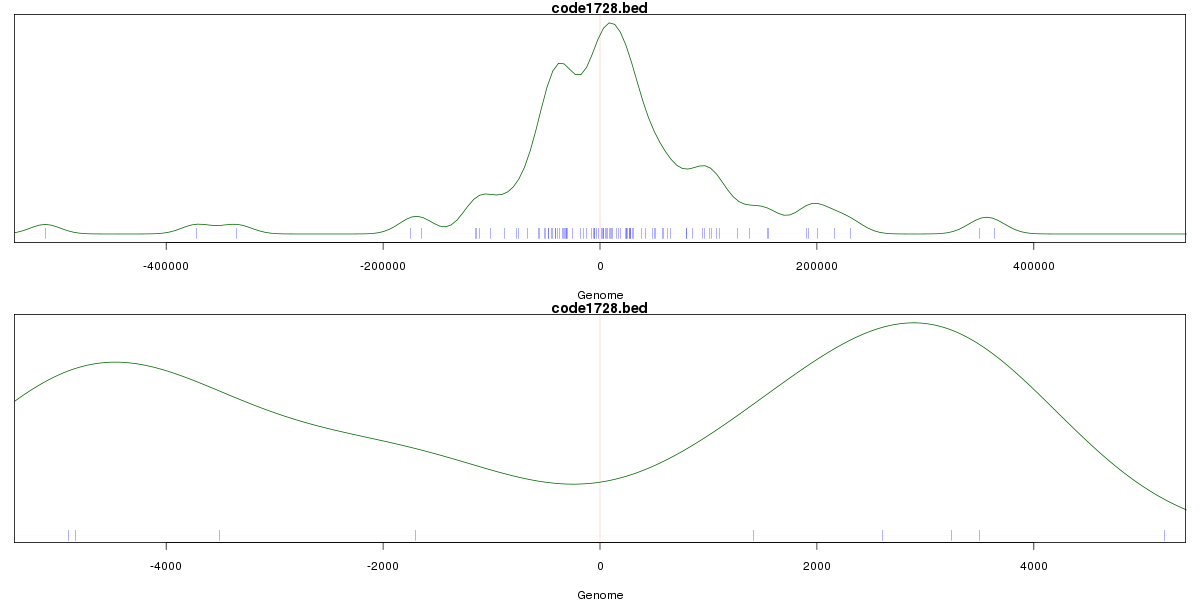
Stats
Number of sites: 143Promoter: 1%
CpG-Island: 0%
Conserved: 40%
Enriched Motifs & Matches
Match Detail: [Jaspar]
|
| ||
|---|---|---|
| Sites: 43/100 | e-val: 0.00000000041 | ||
| Factor | e-val(match) | DB |
| CEBPA | 0.00082278 | JASPAR |
| IRF1 | 0.0027972 | JASPAR |
| Foxq1 | 0.0042346 | JASPAR |
| Foxd3 | 0.0043611 | JASPAR |
| Foxa2 | 0.0044819 | JASPAR |
|
| ||
| Sites: 42/100 | e-val: 0.012 | ||
| Factor | e-val(match) | DB |
| CEBPA | 0.000005333 | JASPAR |
| Pou5f1 | 0.00063642 | JASPAR |
| Sox2 | 0.00087486 | JASPAR |
| NFIL3 | 0.0015144 | JASPAR |
| HLF | 0.0025988 | JASPAR |
BED file downloads
Top 10 Example Regions
| Location | Gene Link | Dist. |
|---|---|---|
| chr1: 151388900-151389050 | RP11-126K1.6 | 14.38 |
| chr1: 151388900-151389050 | RFX5 | 14.38 |
| chr1: 151388900-151389050 | POGZ | 14.38 |
| chr1: 218711020-218711170 | U3 | 55.04 |
| chr12: 10724900-10725050 | KLRAP1 | 57.29 |
| chr11: 114150800-114150950 | NNMT | 64.02 |
| chr5: 76975740-76975890 | TBCA | 66.34 |
| chr12: 123929040-123929190 | SETD8 | 71.92 |
| chr17: 40399860-40400010 | KCNH4 | 73.37 |
| chrX: 24102820-24102970 | ZFX | 74.08 |