SOM cluster: 173
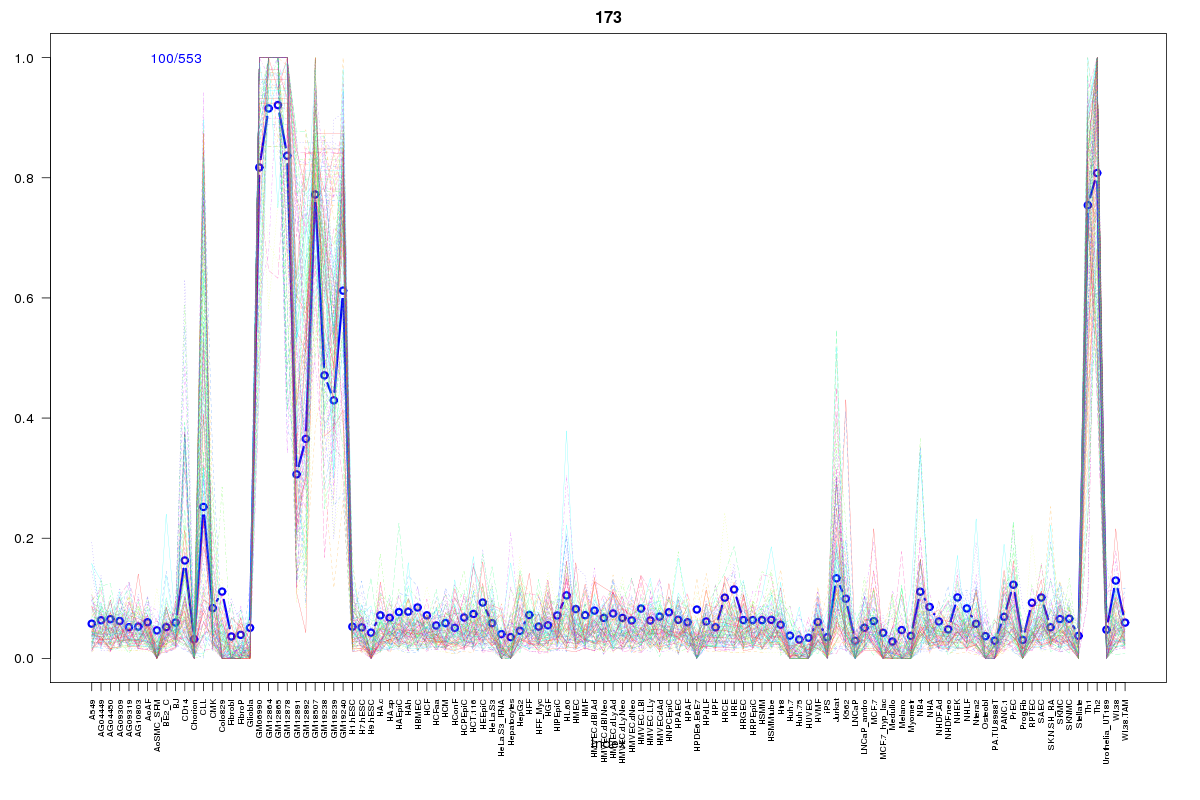
Cluster Hypersensitivity Profile

Genomic Location Trend
These plots show the distribution of the DHS sites surrounding the Transcript Start Site of the nearest gene.
Stats
Number of sites: 553Promoter: 2%
CpG-Island: 1%
Conserved: 47%
Enriched Motifs & Matches
Match Detail: [Jaspar]
|
| ||
|---|---|---|
| Sites: 19/100 | e-val: 0.018 | ||
| Factor | e-val(match) | DB |
| IRF1 | 0.000035392 | JASPAR |
| Pou5f1 | 0.0032071 | JASPAR |
| IRF2 | 0.0035304 | JASPAR |
| NFATC2 | 0.0056056 | JASPAR |
| SOX10 | 0.0064307 | JASPAR |
|
| ||
| Sites: 38/100 | e-val: 0.002 | ||
| Factor | e-val(match) | DB |
| Pax6 | 0.00054864 | JASPAR |
| T | 0.0022331 | JASPAR |
| NKX3-1 | 0.0059763 | JASPAR |
| Tcfcp2l1 | 0.019533 | JASPAR |
| IRF2 | 0.021538 | JASPAR |
BED file downloads
Top 10 Example Regions
| Location | Gene Link | Dist. |
|---|---|---|
| chr12: 27361080-27361230 | STK38L | 32.12 |
| chr8: 142416380-142416530 | MROH5 | 36.64 |
| chr8: 142416380-142416530 | PTP4A3 | 36.64 |
| chr3: 128166420-128166570 | GATA2 | 39.03 |
| chr3: 128166420-128166570 | TMED10P2 | 39.03 |
| chr3: 128166420-128166570 | DNAJB8-AS1 | 39.03 |
| chr3: 128166420-128166570 | EEFSEC | 39.03 |
| chr3: 128166420-128166570 | RP11-475N22.4 | 39.03 |
| chr7: 55584940-55585090 | VOPP1 | 42.2 |
| chr17: 62009685-62009835 | ICAM2 | 47.57 |