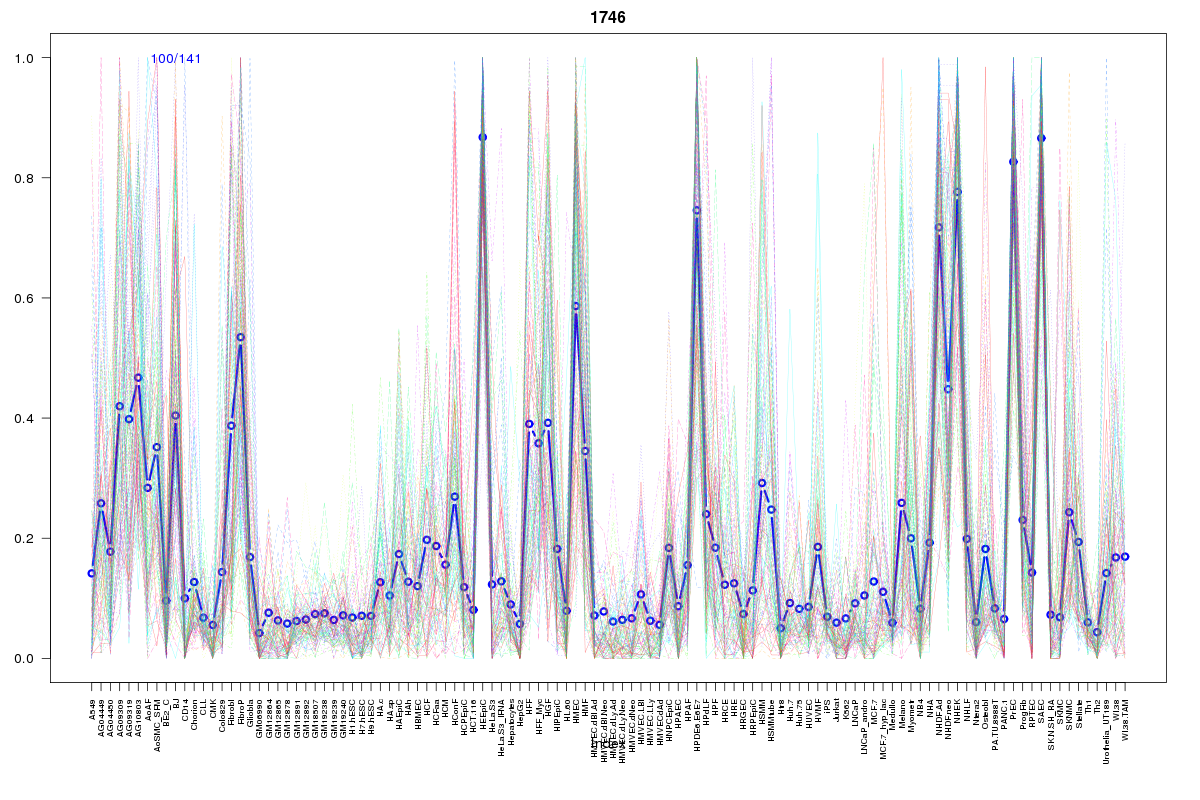
SOM cluster: 1746
Cluster Hypersensitivity Profile

Genomic Location Trend
These plots show the distribution of the DHS sites surrounding the Transcript Start Site of the nearest gene.
Stats
Number of sites: 141Promoter: 0%
CpG-Island: 0%
Conserved: 46%
Enriched Motifs & Matches
Match Detail: [Jaspar]
|
| ||
|---|---|---|
| Sites: 33/100 | e-val: 0.000000069 | ||
| Factor | e-val(match) | DB |
| TP53 | 0.0000018211 | JASPAR |
| NFE2L2 | 0.000095225 | JASPAR |
| znf143 | 0.023098 | JASPAR |
| NR4A2 | 0.05457 | JASPAR |
| Pax2 | 0.083888 | JASPAR |
BED file downloads
Top 10 Example Regions
| Location | Gene Link | Dist. |
|---|---|---|
| chr3: 161002920-161003070 | EEF1GP4 | 47.35 |
| chr10: 11800300-11800450 | PROSER2-AS1 | 55.54 |
| chr2: 74415420-74415570 | FNBP1P1 | 58.7 |
| chr2: 66723000-66723150 | MEIS1 | 66.34 |
| chr5: 95583165-95583315 | RP11-254I22.2 | 67.3 |
| chr6: 108287000-108287150 | SEC63 | 75.77 |
| chr1: 109371080-109371230 | GPSM2 | 76.21 |
| chr6: 44276960-44277110 | NFKBIE | 78.76 |
| chr17: 70464440-70464590 | LINC00511 | 78.84 |
| chr1: 209585060-209585210 | MIR205HG | 81.74 |