SOM cluster: 1770
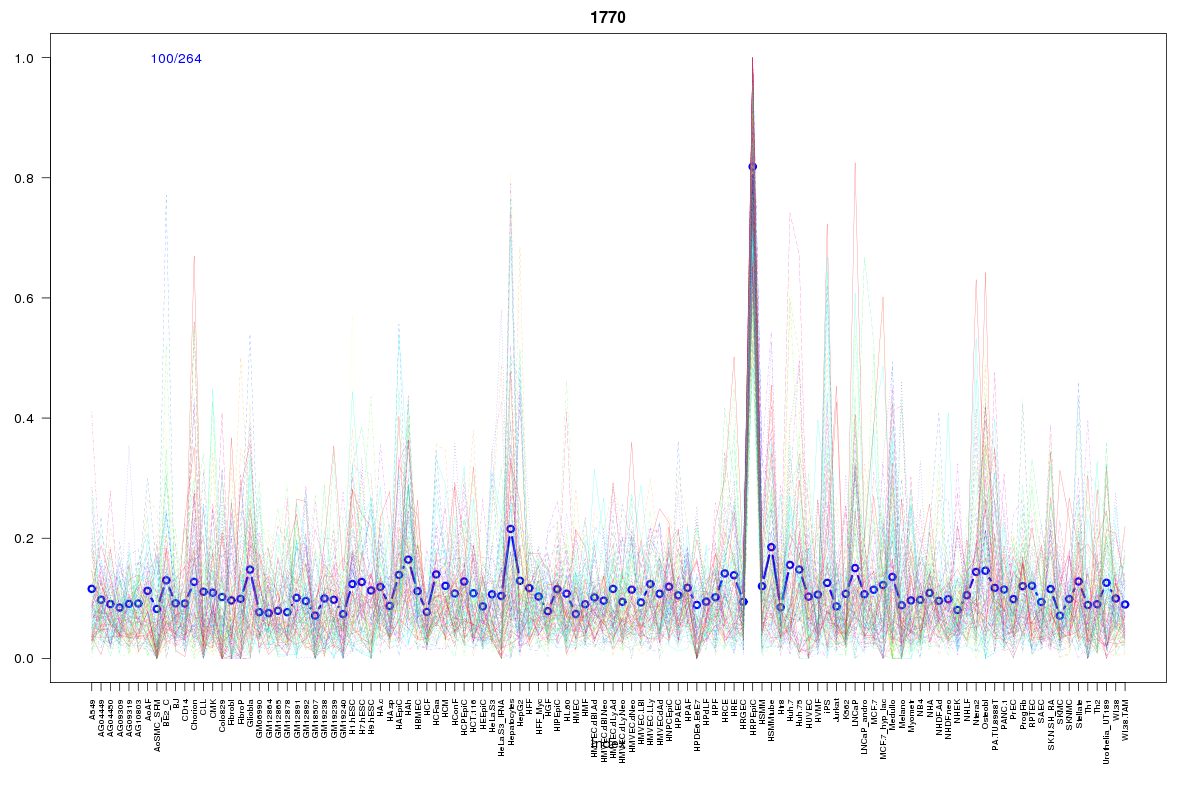
Cluster Hypersensitivity Profile

Genomic Location Trend
These plots show the distribution of the DHS sites surrounding the Transcript Start Site of the nearest gene.
Stats
Number of sites: 264Promoter: 11%
CpG-Island: 5%
Conserved: 34%
Enriched Motifs & Matches
Match Detail: [Jaspar]
|
| ||
|---|---|---|
| Sites: 47/100 | e-val: 1.7e-21 | ||
| Factor | e-val(match) | DB |
| TP53 | 0.00010821 | JASPAR |
| SP1 | 0.00021007 | JASPAR |
| PLAG1 | 0.00099832 | JASPAR |
| Klf4 | 0.0034936 | JASPAR |
| Egr1 | 0.029675 | JASPAR |
BED file downloads
Top 10 Example Regions
| Location | Gene Link | Dist. |
|---|---|---|
| chr10: 23633620-23633770 | C10orf115 | 48.92 |
| chr10: 5687400-5687550 | RP13-463N16.6 | 61.7 |
| chr11: 119239440-119239590 | USP2 | 67.5 |
| chr11: 119239440-119239590 | MFRP | 67.5 |
| chr16: 87495440-87495590 | MAP1LC3B | 67.85 |
| chr16: 87495440-87495590 | ZCCHC14 | 67.85 |
| chr12: 52625380-52625530 | KRT7 | 69.44 |
| chr12: 52625380-52625530 | RP11-845M18.7 | 69.44 |
| chr12: 52625380-52625530 | KRT80 | 69.44 |
| chr12: 52625380-52625530 | KRT86 | 69.44 |