SOM cluster: 1778
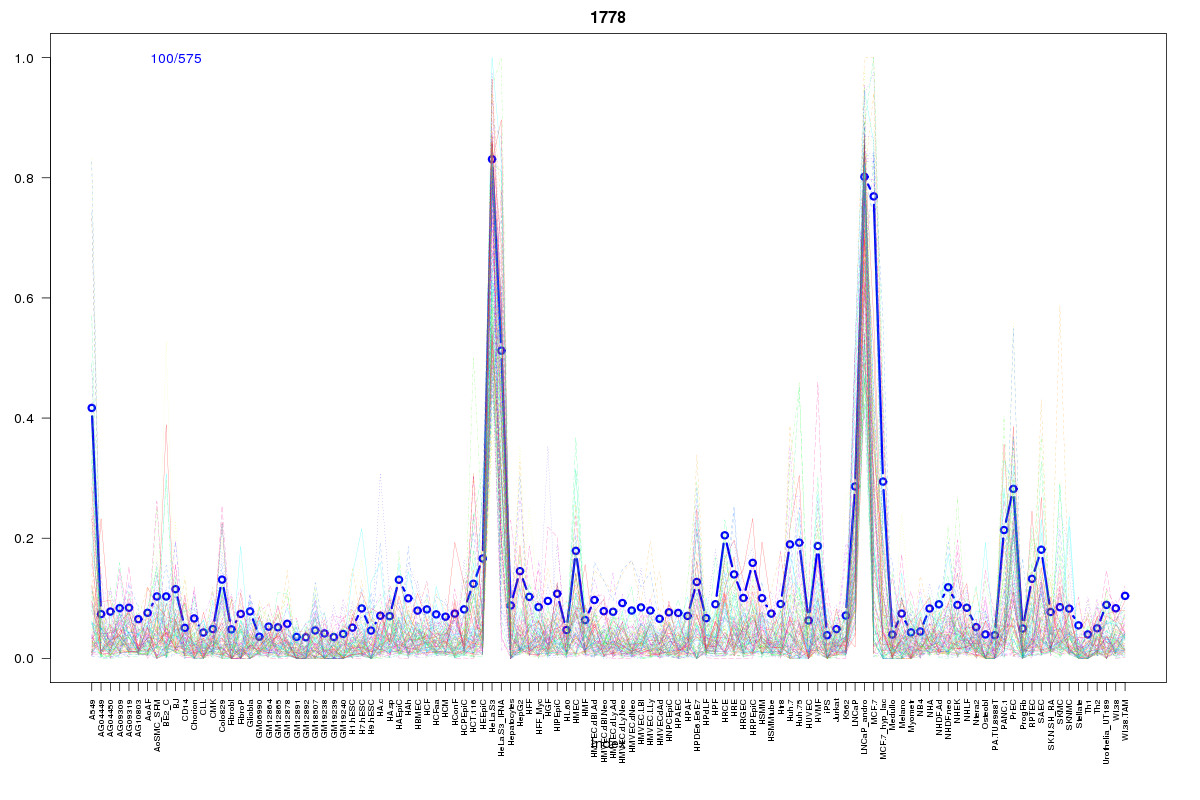
Cluster Hypersensitivity Profile

Genomic Location Trend
These plots show the distribution of the DHS sites surrounding the Transcript Start Site of the nearest gene.
Stats
Number of sites: 575Promoter: 0%
CpG-Island: 0%
Conserved: 41%
Enriched Motifs & Matches
Match Detail: [Jaspar]
|
| ||
|---|---|---|
| Sites: 35/100 | e-val: 0.00000000088 | ||
| Factor | e-val(match) | DB |
| FOXA1 | 0.00000014097 | JASPAR |
| Foxa2 | 0.0000020457 | JASPAR |
| Foxd3 | 0.0000053476 | JASPAR |
| FOXI1 | 0.000040787 | JASPAR |
| FOXF2 | 0.00066979 | JASPAR |
BED file downloads
Top 10 Example Regions
| Location | Gene Link | Dist. |
|---|---|---|
| chr1: 180529440-180529590 | XPR1 | 33.33 |
| chr6: 10311280-10311430 | TFAP2A-AS1 | 51.58 |
| chr8: 40230960-40231110 | CTA-392C11.1 | 53.69 |
| chr3: 161130000-161130150 | OTOL1 | 56.03 |
| chr3: 160514680-160514830 | PPM1L | 57.56 |
| chr6: 11055300-11055450 | SMIM13 | 60.51 |
| chr1: 39582660-39582810 | NDUFS5 | 61.25 |
| chr20: 52765465-52765615 | PFDN4 | 61.51 |
| chr20: 52765465-52765615 | BCAS1 | 61.51 |
| chr6: 142697340-142697490 | GPR126 | 64.75 |