SOM cluster: 1790
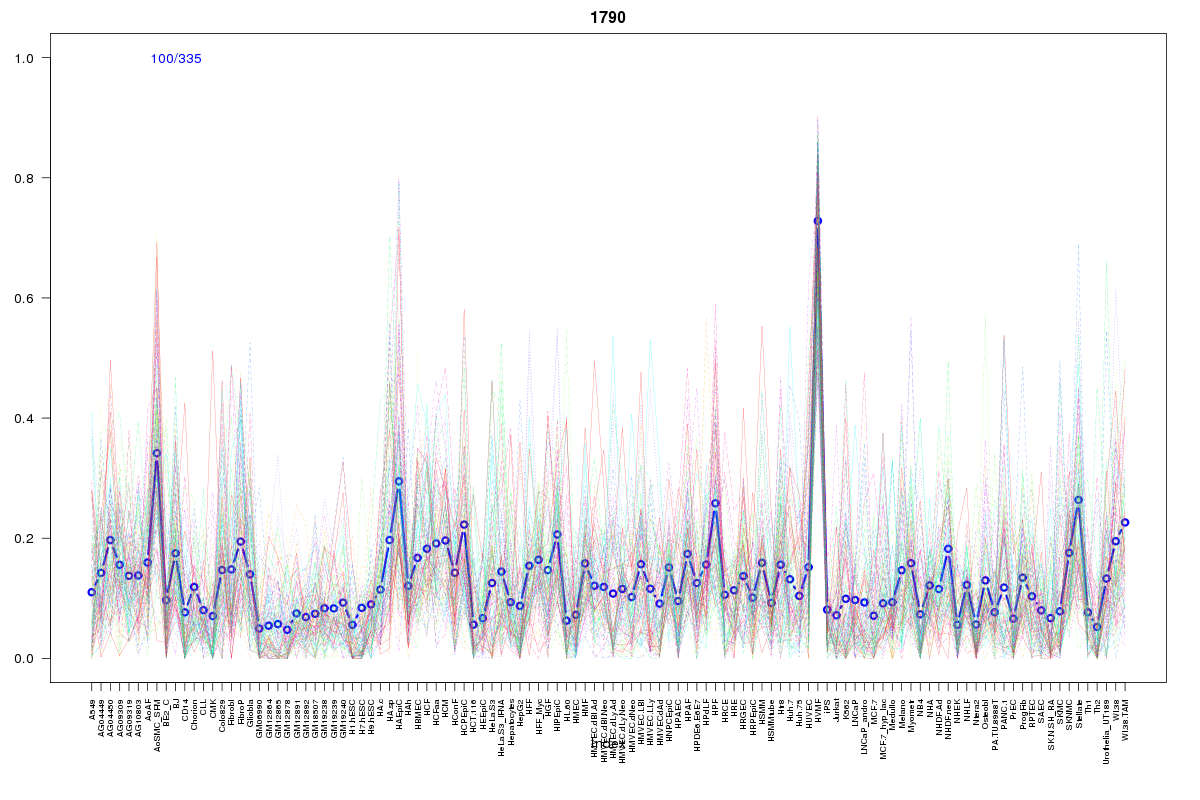
Cluster Hypersensitivity Profile

Genomic Location Trend
These plots show the distribution of the DHS sites surrounding the Transcript Start Site of the nearest gene.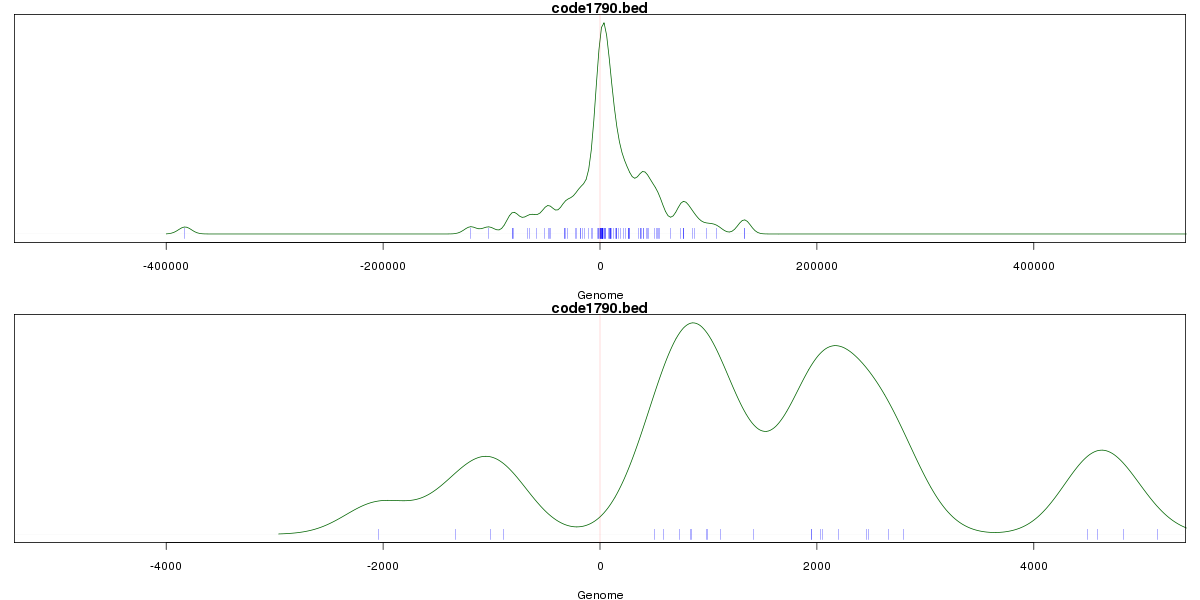
Stats
Number of sites: 335Promoter: 4%
CpG-Island: 0%
Conserved: 40%
Enriched Motifs & Matches
Match Detail: [Jaspar]
|
| ||
|---|---|---|
| Sites: 35/100 | e-val: 0.011 | ||
| Factor | e-val(match) | DB |
| Foxd3 | 0.000000095448 | JASPAR |
| Foxq1 | 0.0000010789 | JASPAR |
| MEF2A | 0.000029107 | JASPAR |
| FOXI1 | 0.00059853 | JASPAR |
| HNF1B | 0.0010283 | JASPAR |
BED file downloads
Top 10 Example Regions
| Location | Gene Link | Dist. |
|---|---|---|
| chr8: 8241780-8241930 | SGK223 | 39.76 |
| chr13: 45902760-45902910 | GTF2F2 | 47.52 |
| chr13: 45902760-45902910 | SNORA31 | 47.52 |
| chr8: 42956980-42957130 | RNU1-124P | 52.63 |
| chr5: 148801605-148801755 | MIR143HG | 56.75 |
| chr5: 148801605-148801755 | AC131025.8 | 56.75 |
| chr22: 20907340-20907490 | KLHL22 | 58.29 |
| chr8: 118990965-118991115 | EXT1 | 62.38 |
| chr13: 31538025-31538175 | TEX26-AS1 | 63.65 |
| chr5: 149679160-149679310 | CAMK2A | 67.42 |