SOM cluster: 1819
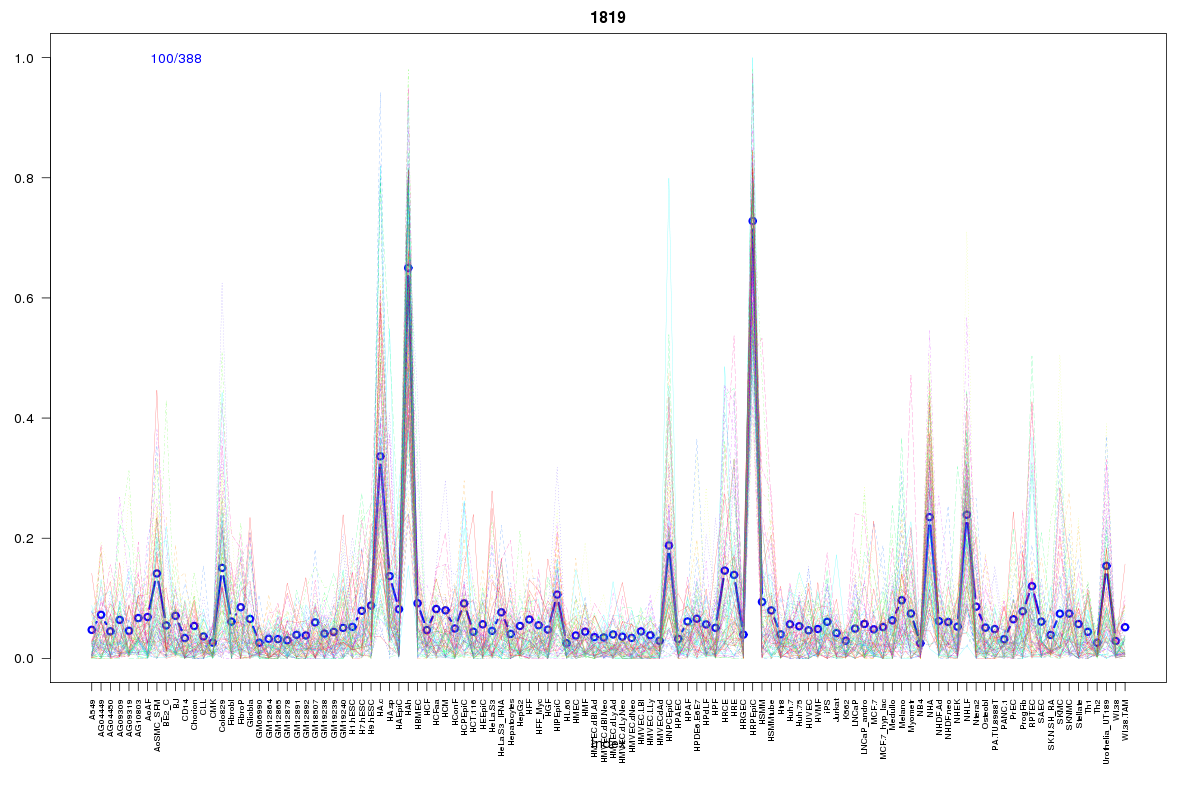
Cluster Hypersensitivity Profile

Genomic Location Trend
These plots show the distribution of the DHS sites surrounding the Transcript Start Site of the nearest gene.
Stats
Number of sites: 388Promoter: 1%
CpG-Island: 0%
Conserved: 49%
Enriched Motifs & Matches
Match Detail: [Jaspar]
|
| ||
|---|---|---|
| Sites: 8/100 | e-val: 0.34 | ||
| Factor | e-val(match) | DB |
| MEF2A | 0.001469 | JASPAR |
| HNF1B | 0.0016488 | JASPAR |
| ARID3A | 0.0024717 | JASPAR |
| Foxd3 | 0.0038159 | JASPAR |
| Lhx3 | 0.0055309 | JASPAR |
BED file downloads
Top 10 Example Regions
| Location | Gene Link | Dist. |
|---|---|---|
| chr3: 126020080-126020230 | RP11-71E19.1 | 35.42 |
| chr4: 169706360-169706510 | RPL9P16 | 52.29 |
| chr13: 51865640-51865790 | SERPINE3 | 56.71 |
| chr3: 21707040-21707190 | ZNF385D | 58.01 |
| chr12: 5065320-5065470 | KCNA1 | 66.39 |
| chr4: 66210240-66210390 | EPHA5 | 70.63 |
| chr7: 20347520-20347670 | ITGB8 | 75.9 |
| chr6: 138891920-138892070 | NHSL1 | 81.07 |
| chr3: 194233780-194233930 | AC108676.1 | 82.58 |
| chr11: 115478760-115478910 | RP11-136I14.4 | 87.8 |