SOM cluster: 1824
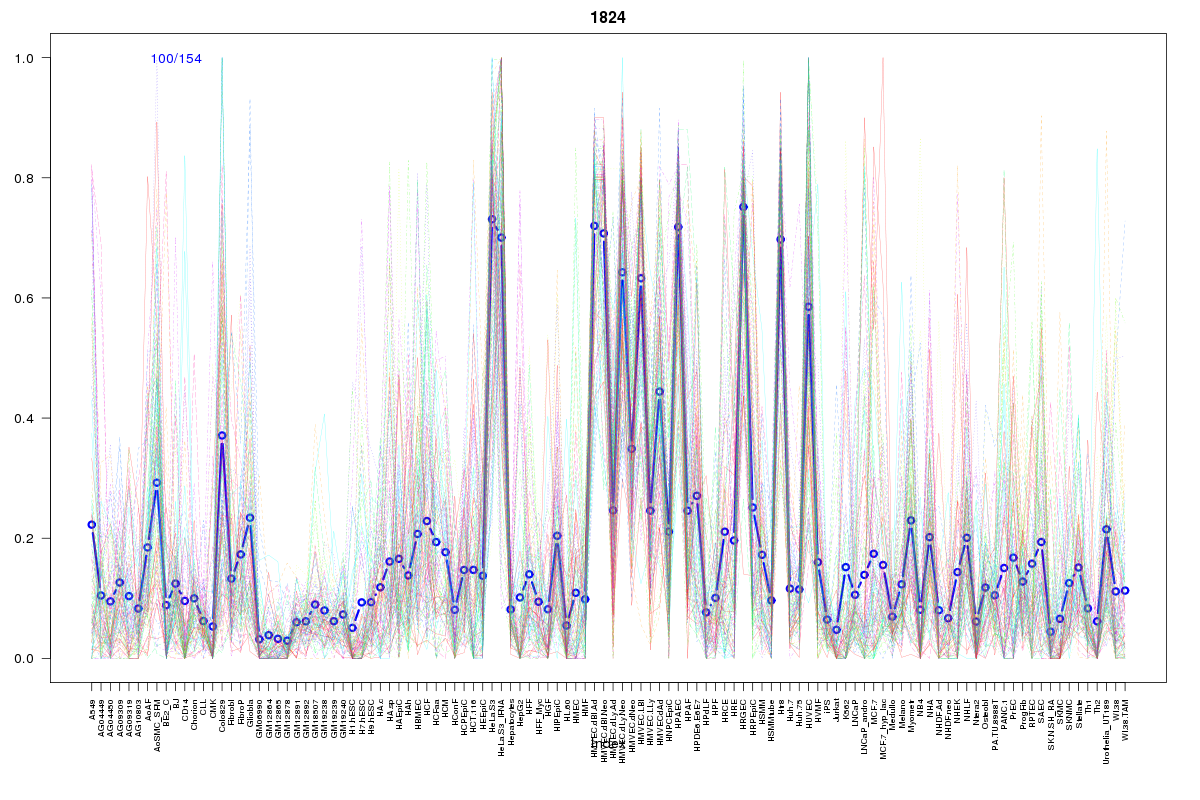
Cluster Hypersensitivity Profile

Genomic Location Trend
These plots show the distribution of the DHS sites surrounding the Transcript Start Site of the nearest gene.
Stats
Number of sites: 154Promoter: 2%
CpG-Island: 0%
Conserved: 43%
Enriched Motifs & Matches
Match Detail: [Jaspar]
|
| ||
|---|---|---|
| Sites: 33/100 | e-val: 0.000000027 | ||
| Factor | e-val(match) | DB |
| AP1 | 0.0000000010234 | JASPAR |
| NFE2L2 | 0.0000000018068 | JASPAR |
| NFE2L1::MafG | 0.00012099 | JASPAR |
| PBX1 | 0.0051821 | JASPAR |
| Pax2 | 0.011523 | JASPAR |
BED file downloads
Top 10 Example Regions
| Location | Gene Link | Dist. |
|---|---|---|
| chr1: 203857905-203858055 | ZBED6 | 28.81 |
| chrX: 9978900-9979050 | WWC3 | 40.66 |
| chrX: 9978900-9979050 | SHROOM2 | 40.66 |
| chrX: 9978900-9979050 | AC002365.1 | 40.66 |
| chr7: 39629580-39629730 | RALA | 40.78 |
| chr7: 39629580-39629730 | AC004837.3 | 40.78 |
| chr8: 110601640-110601790 | SYBU | 44.23 |
| chr11: 65850980-65851130 | PACS1 | 51.27 |
| chr11: 65850980-65851130 | CST6 | 51.27 |
| chr7: 131206480-131206630 | PODXL | 56.29 |