SOM cluster: 185
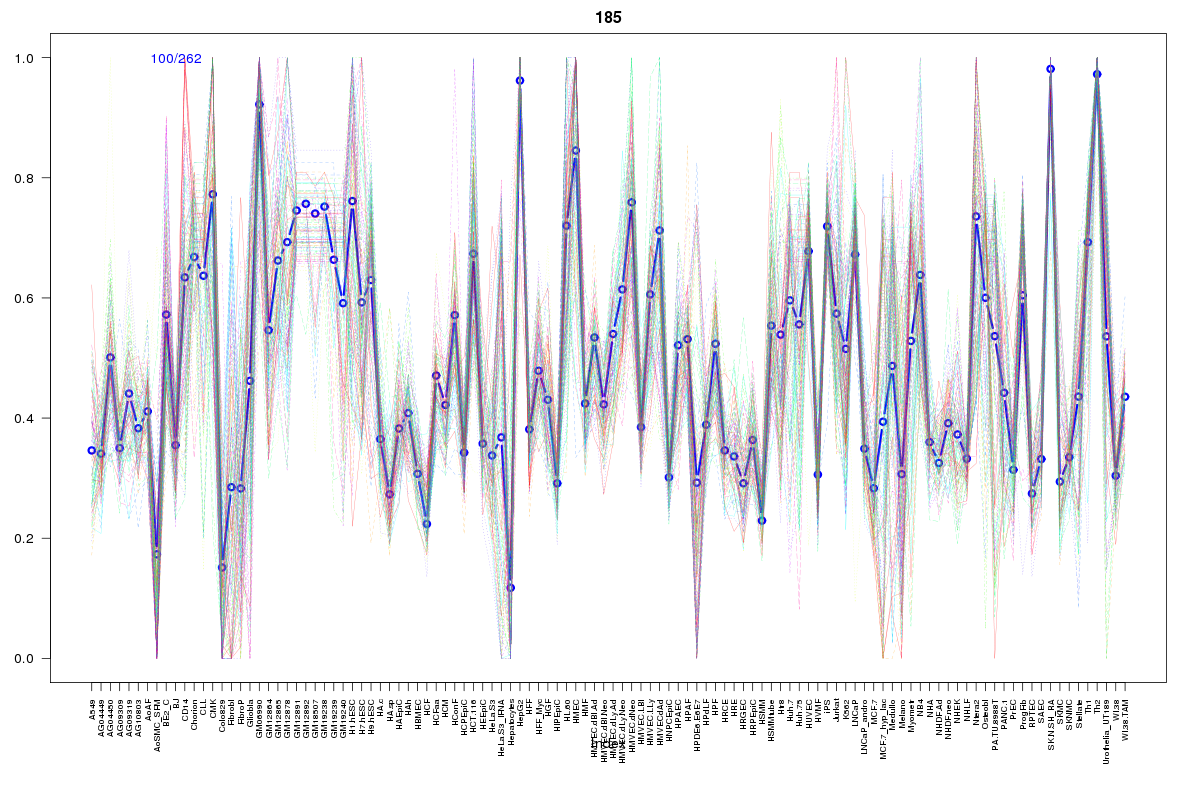
Cluster Hypersensitivity Profile

Genomic Location Trend
These plots show the distribution of the DHS sites surrounding the Transcript Start Site of the nearest gene.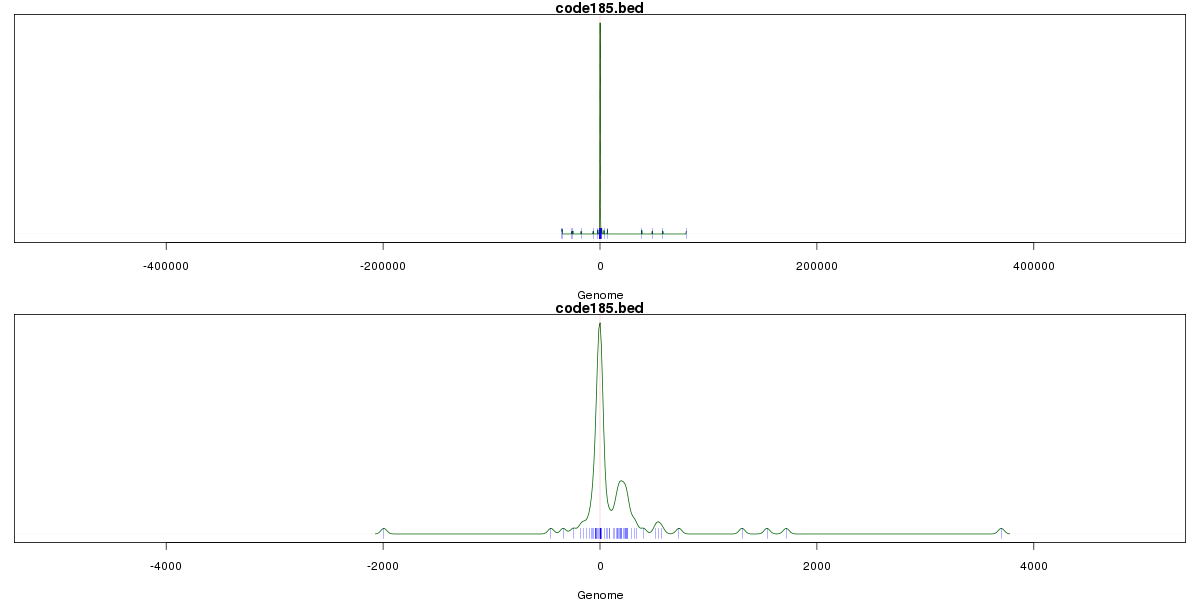
Stats
Number of sites: 262Promoter: 54%
CpG-Island: 93%
Conserved: 80%
Enriched Motifs & Matches
Match Detail: [Jaspar]
|
| ||
|---|---|---|
| Sites: 93/100 | e-val: 0 | ||
| Factor | e-val(match) | DB |
| TFAP2A | 0.00035234 | JASPAR |
| SP1 | 0.002037 | JASPAR |
| PLAG1 | 0.030934 | JASPAR |
| E2F1 | 0.035779 | JASPAR |
| CTCF | 0.050997 | JASPAR |
|
| ||
| Sites: 89/100 | e-val: 0 | ||
| Factor | e-val(match) | DB |
| SP1 | 0.000046701 | JASPAR |
| TFAP2A | 0.002984 | JASPAR |
| PLAG1 | 0.011528 | JASPAR |
| Klf4 | 0.015273 | JASPAR |
| NHLH1 | 0.021321 | JASPAR |
|
| ||
| Sites: 56/100 | e-val: 0.00000027 | ||
| Factor | e-val(match) | DB |
| TFAP2A | 0.000001921 | JASPAR |
| SP1 | 0.000002978 | JASPAR |
| Egr1 | 0.0048673 | JASPAR |
| CTCF | 0.0067927 | JASPAR |
| PLAG1 | 0.010396 | JASPAR |
BED file downloads
Top 10 Example Regions
| Location | Gene Link | Dist. |
|---|---|---|
| chr8: 8243940-8244090 | SGK223 | 37.04 |
| chr8: 42195860-42196010 | POLB | 40.53 |
| chr19: 14116705-14116855 | PODNL1 | 44.92 |
| chr11: 61447760-61447910 | RPLP0P2 | 48.69 |
| chr1: 67396025-67396175 | WDR78 | 50.6 |
| chr7: 33149080-33149230 | RP9 | 59.08 |
| chr7: 33149080-33149230 | BBS9 | 59.08 |
| chr7: 107220560-107220710 | DUS4L | 60.39 |
| chr1: 805220-805370 | RP11-54O7.3 | 60.73 |
| chr1: 805220-805370 | LINC00115 | 60.73 |