SOM cluster: 1878
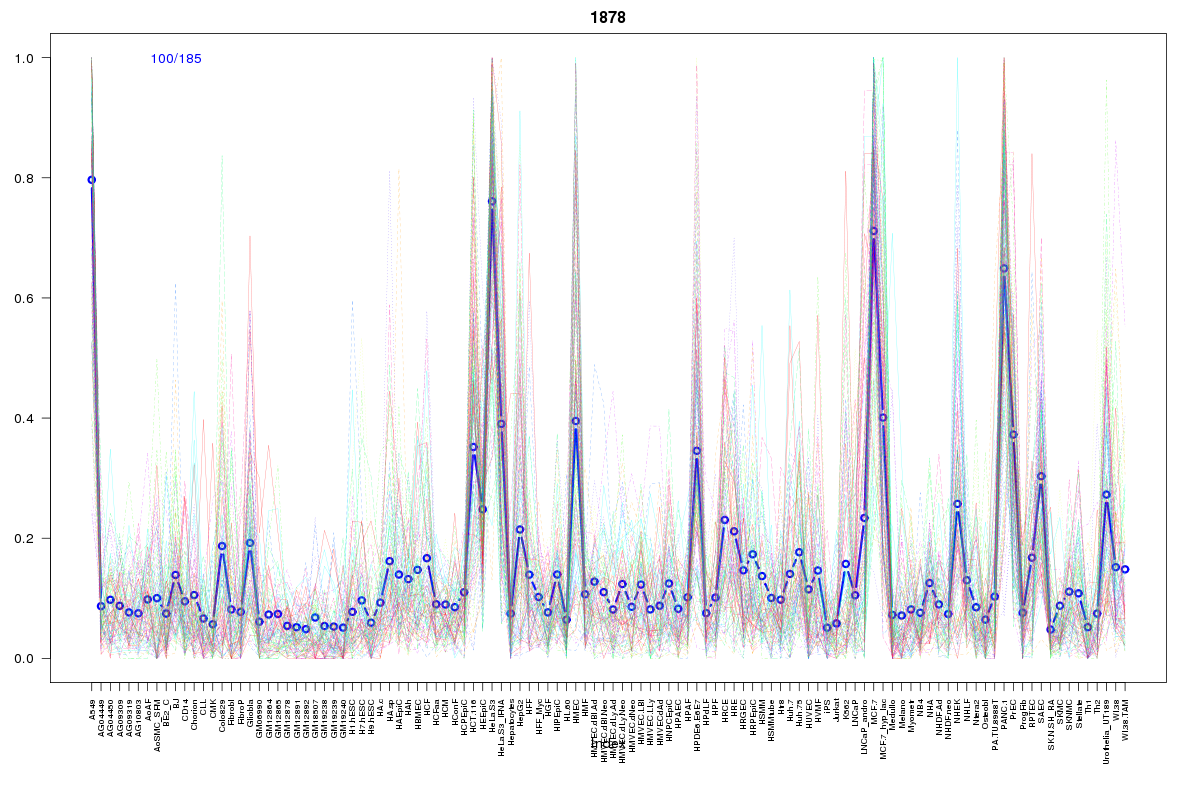
Cluster Hypersensitivity Profile

Genomic Location Trend
These plots show the distribution of the DHS sites surrounding the Transcript Start Site of the nearest gene.
Stats
Number of sites: 185Promoter: 4%
CpG-Island: 0%
Conserved: 29%
Enriched Motifs & Matches
Match Detail: [Jaspar]
|
| ||
|---|---|---|
| Sites: 11/100 | e-val: 0.86 | ||
| Factor | e-val(match) | DB |
| Foxa2 | 0.00060417 | JASPAR |
| FOXI1 | 0.00082576 | JASPAR |
| PBX1 | 0.00092974 | JASPAR |
| MEF2A | 0.00094117 | JASPAR |
| FOXA1 | 0.0010141 | JASPAR |
BED file downloads
Top 10 Example Regions
| Location | Gene Link | Dist. |
|---|---|---|
| chr1: 151170420-151170570 | VPS72 | 25.4 |
| chr1: 151170420-151170570 | ZNF687 | 25.4 |
| chr1: 151170420-151170570 | RP11-126K1.2 | 25.4 |
| chr1: 151170420-151170570 | PI4KB | 25.4 |
| chr1: 151170420-151170570 | PIP5K1A | 25.4 |
| chr2: 26234720-26234870 | RNU6-942P | 39.42 |
| chr2: 26234720-26234870 | RAB10 | 39.42 |
| chr2: 159580560-159580710 | PKP4 | 57.72 |
| chr7: 137774160-137774310 | RCC2P3 | 69.51 |
| chr17: 35208745-35208895 | AATF | 69.96 |