SOM cluster: 188
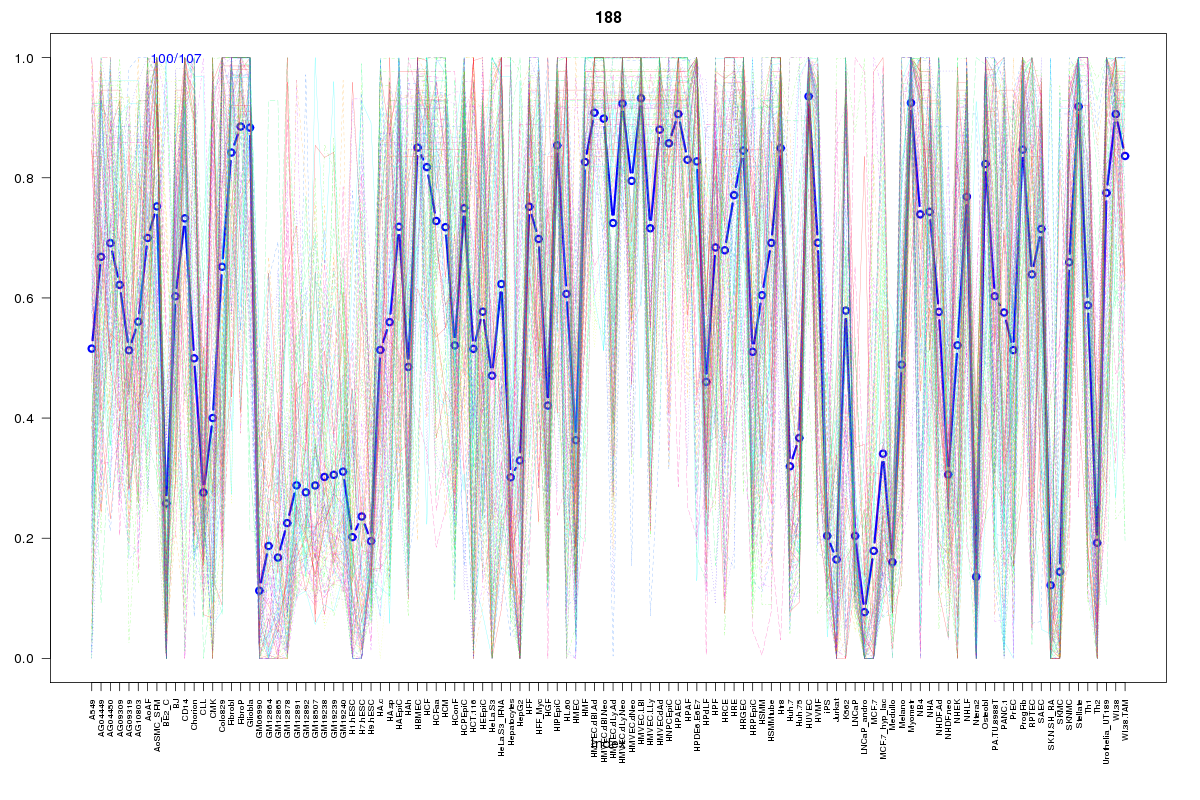
Cluster Hypersensitivity Profile

Genomic Location Trend
These plots show the distribution of the DHS sites surrounding the Transcript Start Site of the nearest gene.
Stats
Number of sites: 107Promoter: 8%
CpG-Island: 6%
Conserved: 51%
Enriched Motifs & Matches
Match Detail: [Jaspar]
|
| ||
|---|---|---|
| Sites: 71/100 | e-val: 0 | ||
| Factor | e-val(match) | DB |
| AP1 | 0.0000000005052 | JASPAR |
| NFE2L2 | 0.00000000087202 | JASPAR |
| NFE2L1::MafG | 0.0017622 | JASPAR |
| Pax2 | 0.002169 | JASPAR |
| PPARG | 0.0026931 | JASPAR |
|
| ||
| Sites: 37/100 | e-val: 2.7e-18 | ||
| Factor | e-val(match) | DB |
| SP1 | 0.0000000035337 | JASPAR |
| Pax4 | 0.000000017453 | JASPAR |
| EWSR1-FLI1 | 0.000058231 | JASPAR |
| SPIB | 0.000075984 | JASPAR |
| MZF1_5-13 | 0.00056149 | JASPAR |
|
| ||
| Sites: 52/100 | e-val: 0.0000048 | ||
| Factor | e-val(match) | DB |
| FEV | 0.00000000011512 | JASPAR |
| Stat3 | 0.000000030516 | JASPAR |
| ELF5 | 0.0000047379 | JASPAR |
| SPI1 | 0.0000076479 | JASPAR |
| SPIB | 0.000015598 | JASPAR |
BED file downloads
Top 10 Example Regions
| Location | Gene Link | Dist. |
|---|---|---|
| chr22: 46943900-46944050 | GRAMD4 | 49.55 |
| chr22: 46943900-46944050 | RP5-996D20.3 | 49.55 |
| chr3: 42694320-42694470 | CCDC13 | 50.73 |
| chr2: 70161580-70161730 | GMCL1 | 50.95 |
| chr2: 70161580-70161730 | PCBP1-AS1 | 50.95 |
| chr2: 70161580-70161730 | snoU13 | 50.95 |
| chr2: 160353840-160353990 | AC008277.1 | 52.15 |
| chr20: 32400140-32400290 | PXMP4 | 55.41 |
| chr20: 32400140-32400290 | RP4-553F4.6 | 55.41 |
| chr3: 152939660-152939810 | RAP2B | 61.42 |