SOM cluster: 190
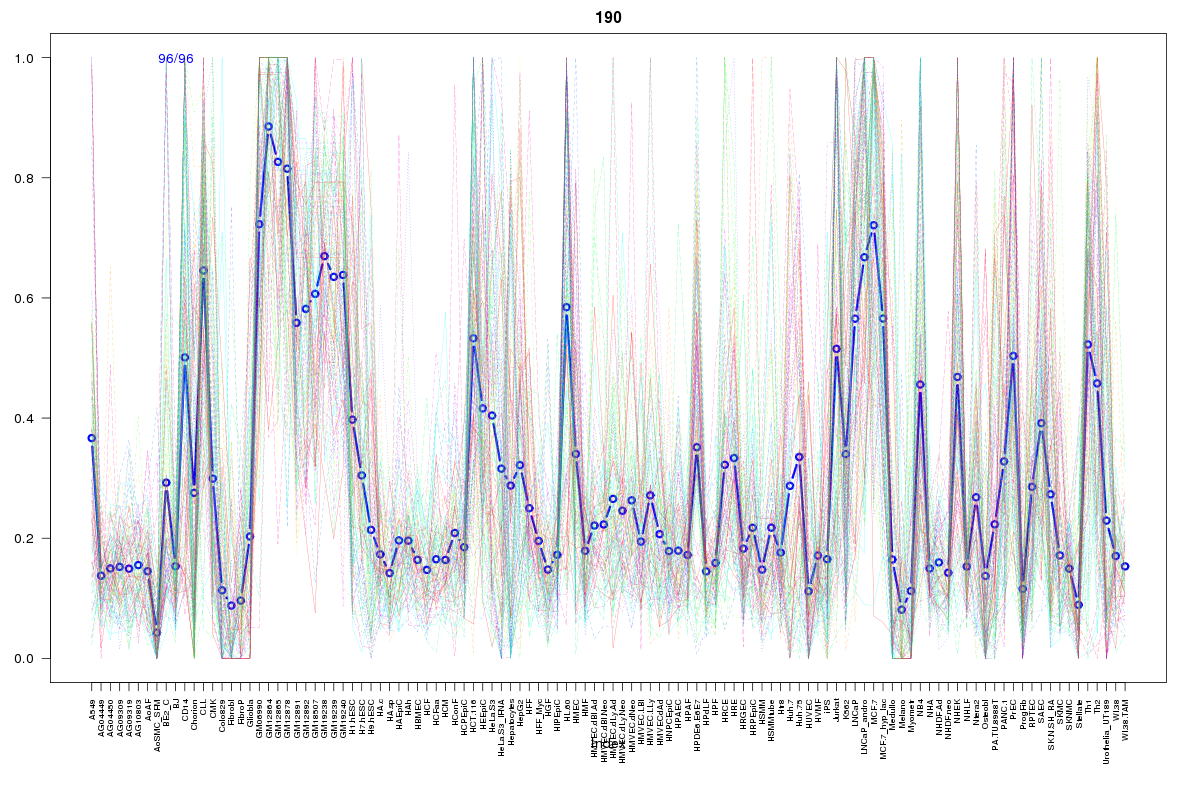
Cluster Hypersensitivity Profile

Genomic Location Trend
These plots show the distribution of the DHS sites surrounding the Transcript Start Site of the nearest gene.
Stats
Number of sites: 96Promoter: 28%
CpG-Island: 18%
Conserved: 50%
Enriched Motifs & Matches
Match Detail: [Jaspar]
|
| ||
|---|---|---|
| Sites: 47/96 | e-val: 0.00000087 | ||
| Factor | e-val(match) | DB |
| SP1 | 0.000030297 | JASPAR |
| Tal1::Gata1 | 0.00031892 | JASPAR |
| Pax4 | 0.00065098 | JASPAR |
| EWSR1-FLI1 | 0.0028475 | JASPAR |
| RREB1 | 0.0048141 | JASPAR |
BED file downloads
Top 10 Example Regions
| Location | Gene Link | Dist. |
|---|---|---|
| chr17: 76919760-76919910 | TIMP2 | 44.35 |
| chr19: 51297680-51297830 | KLK2 | 46.83 |
| chr19: 51297680-51297830 | CLEC11A | 46.83 |
| chr19: 51297680-51297830 | C19orf48 | 46.83 |
| chr19: 51297680-51297830 | KLK1 | 46.83 |
| chr20: 279220-279370 | AL034548.1 | 57.88 |
| chr20: 279220-279370 | NRSN2 | 57.88 |
| chr20: 279220-279370 | ZCCHC3 | 57.88 |
| chr20: 32320340-32320490 | ZNF341 | 73.26 |
| chr20: 32320340-32320490 | ACTL10 | 73.26 |