SOM cluster: 1908
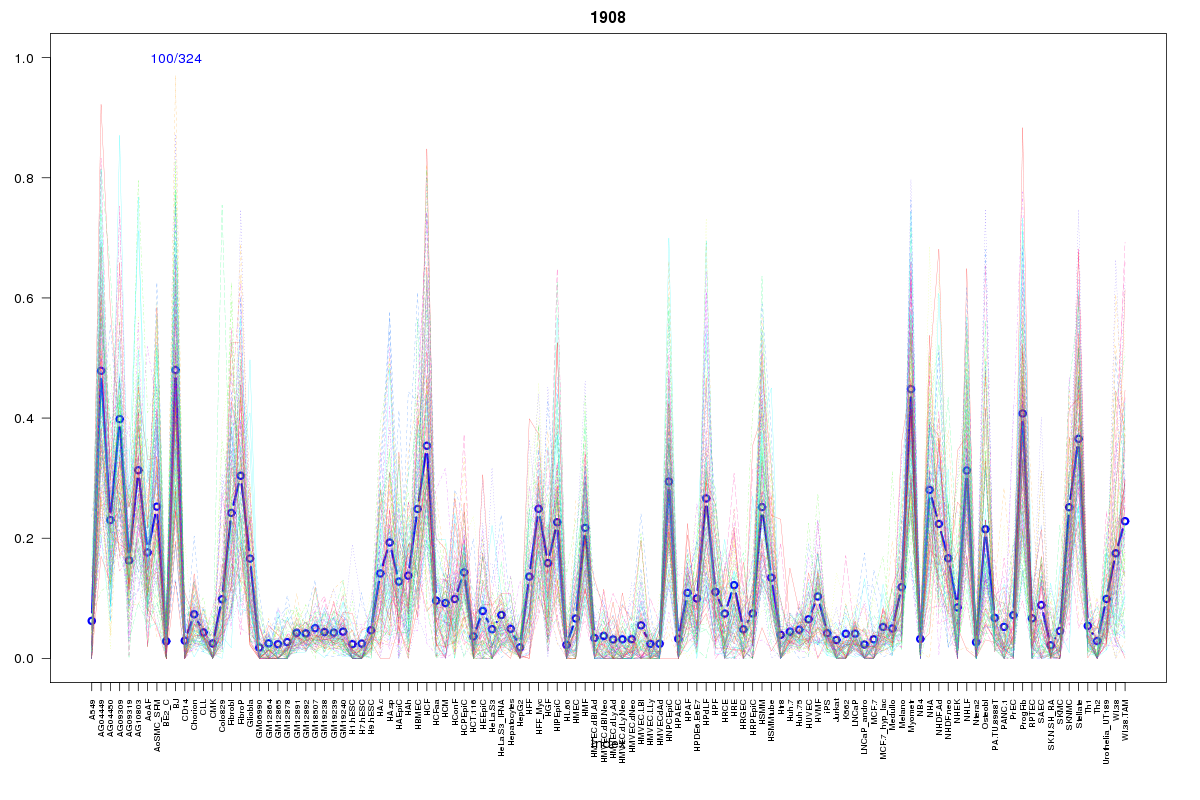
Cluster Hypersensitivity Profile

Genomic Location Trend
These plots show the distribution of the DHS sites surrounding the Transcript Start Site of the nearest gene.
Stats
Number of sites: 324Promoter: 2%
CpG-Island: 0%
Conserved: 24%
Enriched Motifs & Matches
Match Detail: [Jaspar]
|
| ||
|---|---|---|
| Sites: 45/100 | e-val: 0.0000000000000043 | ||
| Factor | e-val(match) | DB |
| Pou5f1 | 0.0030697 | JASPAR |
| HNF1A | 0.0059154 | JASPAR |
| HNF1B | 0.0065102 | JASPAR |
| MEF2A | 0.0067251 | JASPAR |
| Pax4 | 0.0076483 | JASPAR |
BED file downloads
Top 10 Example Regions
| Location | Gene Link | Dist. |
|---|---|---|
| chr3: 149180560-149180710 | RP11-278L15.4 | 27.88 |
| chr11: 58909440-58909590 | DTX4 | 36.53 |
| chr11: 58909440-58909590 | FAM111B | 36.53 |
| chr11: 32056300-32056450 | RCN1 | 40.9 |
| chr12: 117450265-117450415 | RP11-103B5.2 | 43.99 |
| chr12: 117450265-117450415 | TESC | 43.99 |
| chr10: 120871760-120871910 | SNORA19 | 48.21 |
| chr10: 120871760-120871910 | SFXN4 | 48.21 |
| chr10: 120871760-120871910 | NANOS1 | 48.21 |
| chr10: 120871760-120871910 | GRK5 | 48.21 |