SOM cluster: 1910
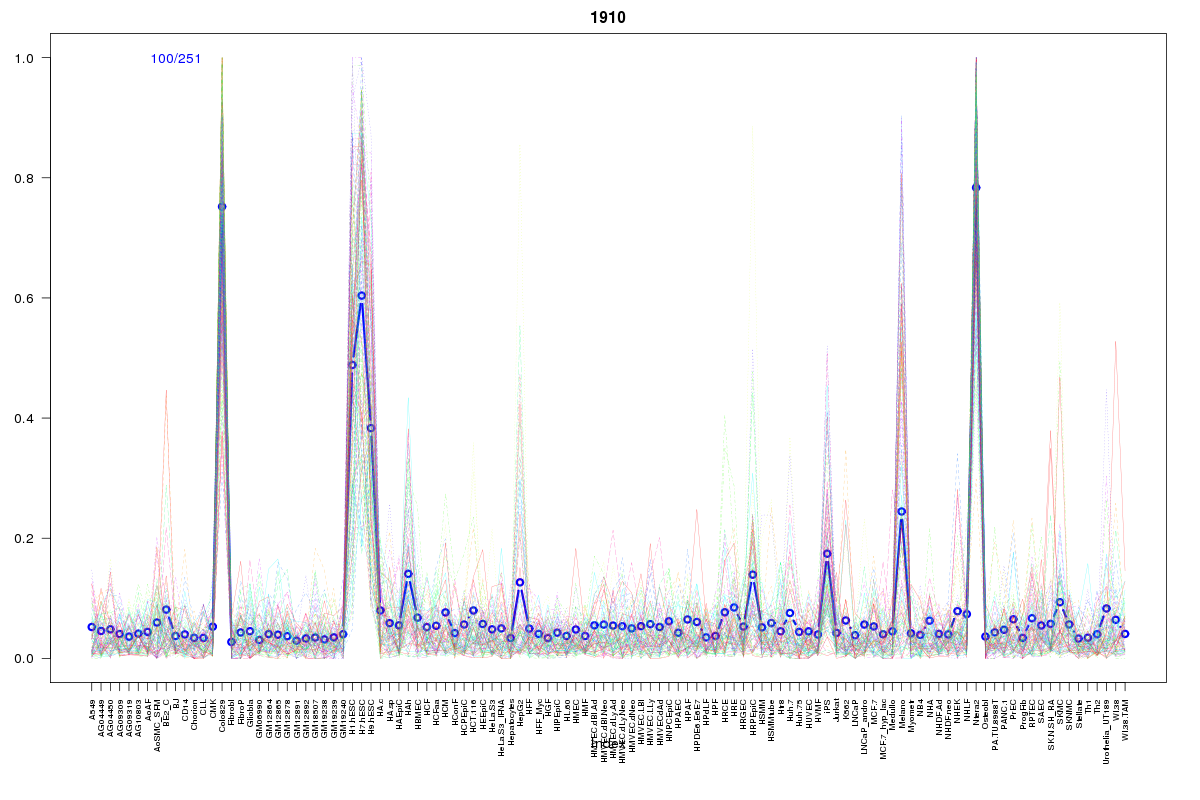
Cluster Hypersensitivity Profile

Genomic Location Trend
These plots show the distribution of the DHS sites surrounding the Transcript Start Site of the nearest gene.
Stats
Number of sites: 251Promoter: 4%
CpG-Island: 0%
Conserved: 67%
Enriched Motifs & Matches
Match Detail: [Jaspar]
|
| ||
|---|---|---|
| Sites: 45/100 | e-val: 3.6e-21 | ||
| Factor | e-val(match) | DB |
| SOX10 | 0.000021997 | JASPAR |
| Sox2 | 0.000045403 | JASPAR |
| Pou5f1 | 0.00021396 | JASPAR |
| SRY | 0.0080558 | JASPAR |
| SOX9 | 0.00818 | JASPAR |
BED file downloads
Top 10 Example Regions
| Location | Gene Link | Dist. |
|---|---|---|
| chr1: 147039480-147039630 | BCL9 | 16.73 |
| chr7: 42232900-42233050 | GLI3 | 37.39 |
| chr1: 167105785-167105935 | POU2F1 | 56.16 |
| chr1: 167105785-167105935 | RP11-277B15.1 | 56.16 |
| chr5: 146168620-146168770 | PPP2R2B | 62.07 |
| chr6: 29629640-29629790 | GABBR1 | 62.54 |
| chr6: 10396260-10396410 | LINC00518 | 63.3 |
| chr3: 193428600-193428750 | OPA1-AS1 | 64.82 |
| chr11: 46998800-46998950 | LRP4 | 66.35 |
| chr1: 157083500-157083650 | ETV3 | 72.89 |