SOM cluster: 1924
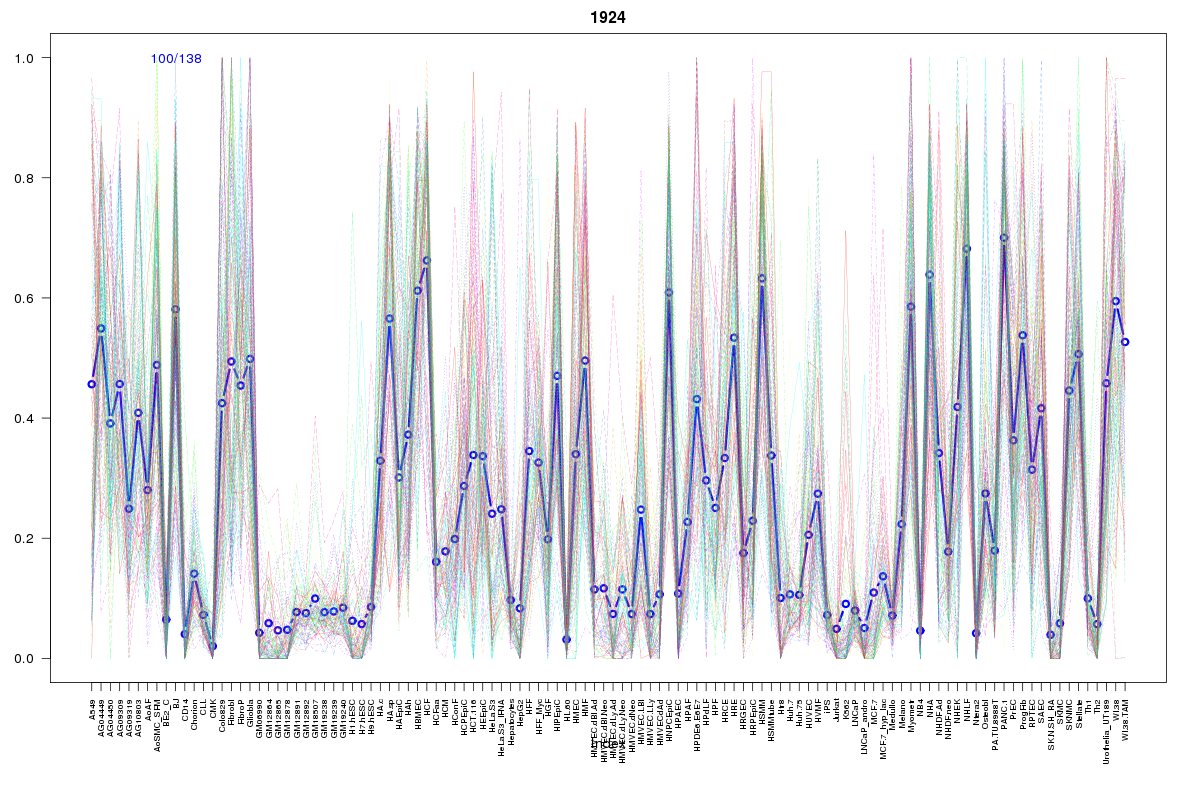
Cluster Hypersensitivity Profile

Genomic Location Trend
These plots show the distribution of the DHS sites surrounding the Transcript Start Site of the nearest gene.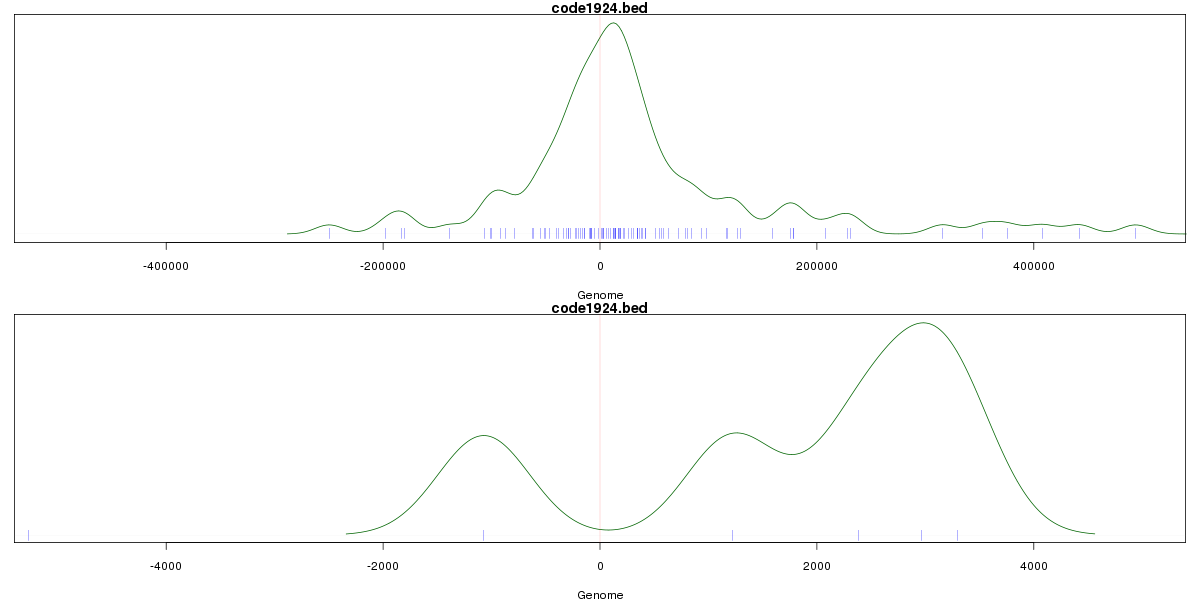
Stats
Number of sites: 138Promoter: 1%
CpG-Island: 0%
Conserved: 35%
Enriched Motifs & Matches
Match Detail: [Jaspar]
|
| ||
|---|---|---|
| Sites: 55/100 | e-val: 1.9e-24 | ||
| Factor | e-val(match) | DB |
| AP1 | 0.00000000049886 | JASPAR |
| NFE2L2 | 0.00000002729 | JASPAR |
| NFE2L1::MafG | 0.00022595 | JASPAR |
| PBX1 | 0.0030104 | JASPAR |
| RXRA::VDR | 0.039716 | JASPAR |
BED file downloads
Top 10 Example Regions
| Location | Gene Link | Dist. |
|---|---|---|
| chr10: 21687560-21687710 | RNMTL1P1 | 44.33 |
| chr5: 73529500-73529650 | CTD-2275D24.2 | 58.35 |
| chr5: 73529500-73529650 | CTD-2275D24.4 | 58.35 |
| chr11: 122539600-122539750 | UBASH3B | 60.8 |
| chr1: 77787740-77787890 | AK5 | 65.21 |
| chr6: 108885360-108885510 | FOXO3 | 66.72 |
| chr3: 187962260-187962410 | LPP | 68.16 |
| chr11: 73767100-73767250 | RP11-167N4.2 | 68.82 |
| chr9: 36102300-36102450 | RECK | 73.09 |
| chr9: 36102300-36102450 | OR2AM1P | 73.09 |