SOM cluster: 1928
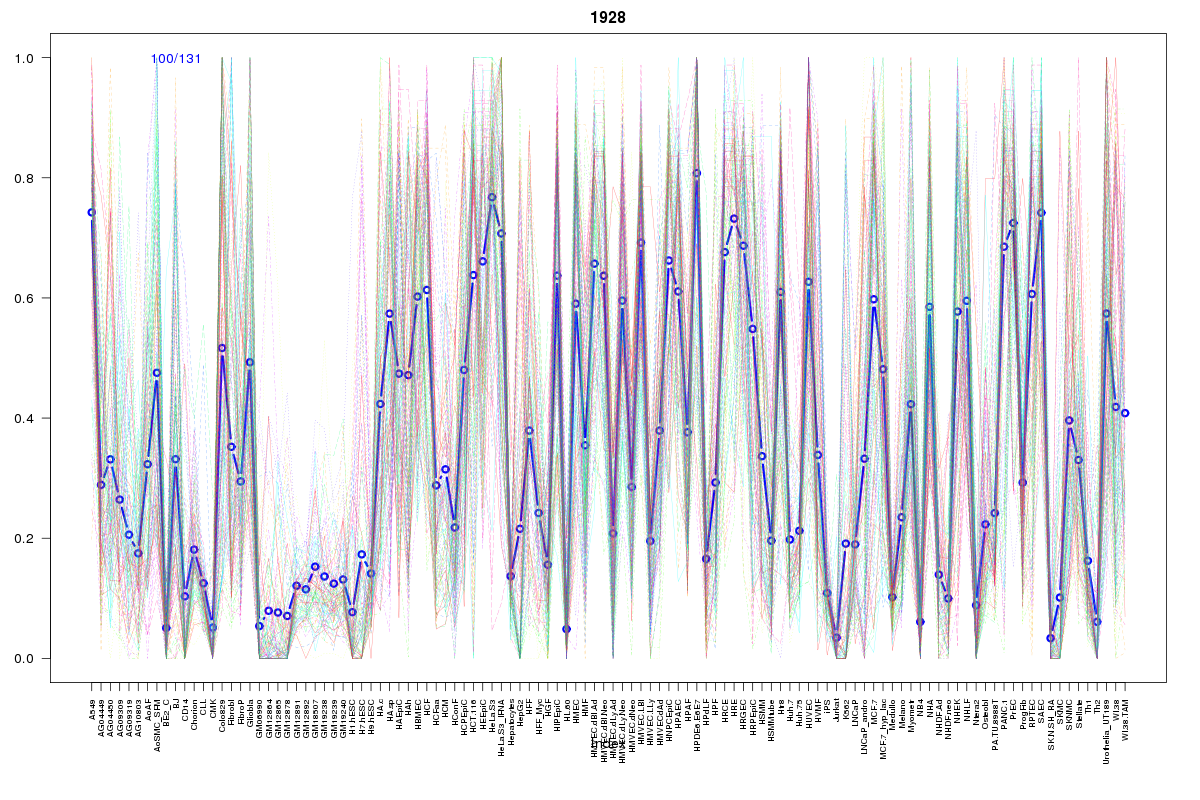
Cluster Hypersensitivity Profile

Genomic Location Trend
These plots show the distribution of the DHS sites surrounding the Transcript Start Site of the nearest gene.
Stats
Number of sites: 131Promoter: 3%
CpG-Island: 0%
Conserved: 46%
Enriched Motifs & Matches
Match Detail: [Jaspar]
|
| ||
|---|---|---|
| Sites: 58/100 | e-val: 1.2e-38 | ||
| Factor | e-val(match) | DB |
| AP1 | 0.000000031943 | JASPAR |
| NFE2L2 | 0.00001443 | JASPAR |
| NFE2L1::MafG | 0.030682 | JASPAR |
| RORA_1 | 0.043379 | JASPAR |
| SRF | 0.080846 | JASPAR |
|
| ||
| Sites: 22/100 | e-val: 0.041 | ||
| Factor | e-val(match) | DB |
| Foxa2 | 0.000000000000015432 | JASPAR |
| FOXA1 | 0.000000000013689 | JASPAR |
| FOXD1 | 0.00000062321 | JASPAR |
| FOXO3 | 0.0000007667 | JASPAR |
| FOXI1 | 0.0000013001 | JASPAR |
BED file downloads
Top 10 Example Regions
| Location | Gene Link | Dist. |
|---|---|---|
| chr5: 73928025-73928175 | HEXB | 50.65 |
| chr5: 73928025-73928175 | ENC1 | 50.65 |
| chr4: 174133140-174133290 | GALNT7 | 53.04 |
| chr5: 149318020-149318170 | AC008427.2 | 57.7 |
| chr5: 149318020-149318170 | SLC26A2 | 57.7 |
| chr10: 82266060-82266210 | TSPAN14 | 59.31 |
| chr10: 98783940-98784090 | SLIT1 | 62.44 |
| chr10: 98783940-98784090 | LCOR | 62.44 |
| chr17: 57833600-57833750 | MIR21 | 62.64 |
| chr17: 57833600-57833750 | VMP1 | 62.64 |