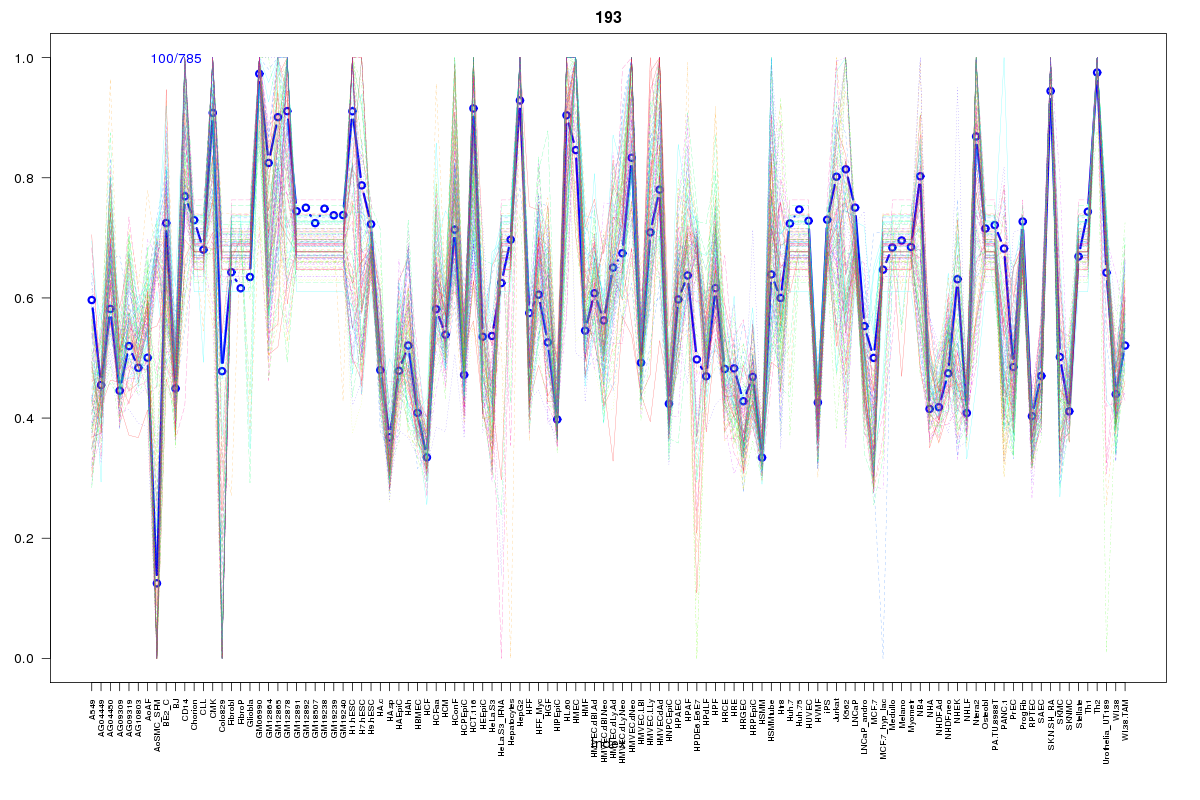
SOM cluster: 193
Cluster Hypersensitivity Profile

Genomic Location Trend
These plots show the distribution of the DHS sites surrounding the Transcript Start Site of the nearest gene.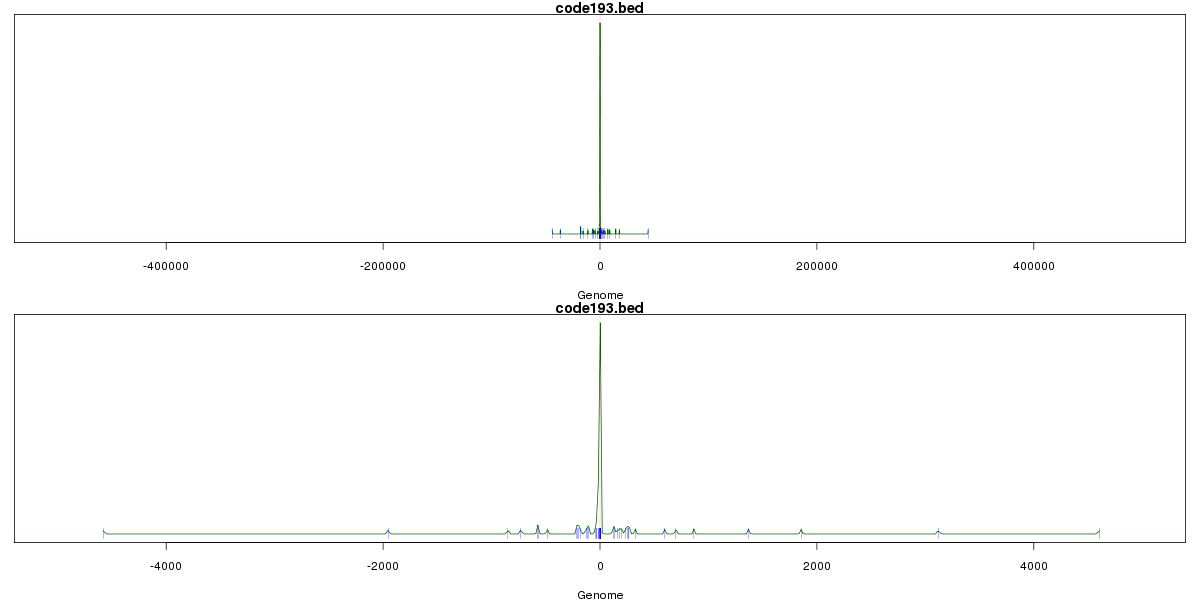
Stats
Number of sites: 785Promoter: 68%
CpG-Island: 86%
Conserved: 80%
Enriched Motifs & Matches
Match Detail: [Jaspar]
|
| ||
|---|---|---|
| Sites: 95/100 | e-val: 0 | ||
| Factor | e-val(match) | DB |
| SP1 | 0.0000000010402 | JASPAR |
| TFAP2A | 0.00026813 | JASPAR |
| Klf4 | 0.0013229 | JASPAR |
| PLAG1 | 0.0068896 | JASPAR |
| Egr1 | 0.0084532 | JASPAR |
|
| ||
| Sites: 81/100 | e-val: 2.6e-30 | ||
| Factor | e-val(match) | DB |
| TFAP2A | 0.0064988 | JASPAR |
| SP1 | 0.013963 | JASPAR |
| Egr1 | 0.024029 | JASPAR |
| NHLH1 | 0.024112 | JASPAR |
| Klf4 | 0.02977 | JASPAR |
|
| ||
| Sites: 55/100 | e-val: 2.8 | ||
| Factor | e-val(match) | DB |
| SP1 | 0.00024086 | JASPAR |
| Zfx | 0.0067173 | JASPAR |
| NHLH1 | 0.01155 | JASPAR |
| Klf4 | 0.015742 | JASPAR |
| Egr1 | 0.041267 | JASPAR |
BED file downloads
Top 10 Example Regions
| Location | Gene Link | Dist. |
|---|---|---|
| chr19: 38852600-38852750 | SPINT2 | 11.57 |
| chr19: 50918140-50918290 | POLD1 | 45.59 |
| chr19: 10305300-10305450 | PPAN-P2RY11 | 49.95 |
| chr19: 10305300-10305450 | EIF3G | 49.95 |
| chr19: 10305300-10305450 | P2RY11 | 49.95 |
| chr19: 10305300-10305450 | ANGPTL6 | 49.95 |
| chr19: 10305300-10305450 | MRPL4 | 49.95 |
| chr19: 10305300-10305450 | DNMT1 | 49.95 |
| chr19: 10305300-10305450 | PPAN | 49.95 |
| chr3: 52017145-52017295 | RRP9 | 50.29 |