SOM cluster: 1930
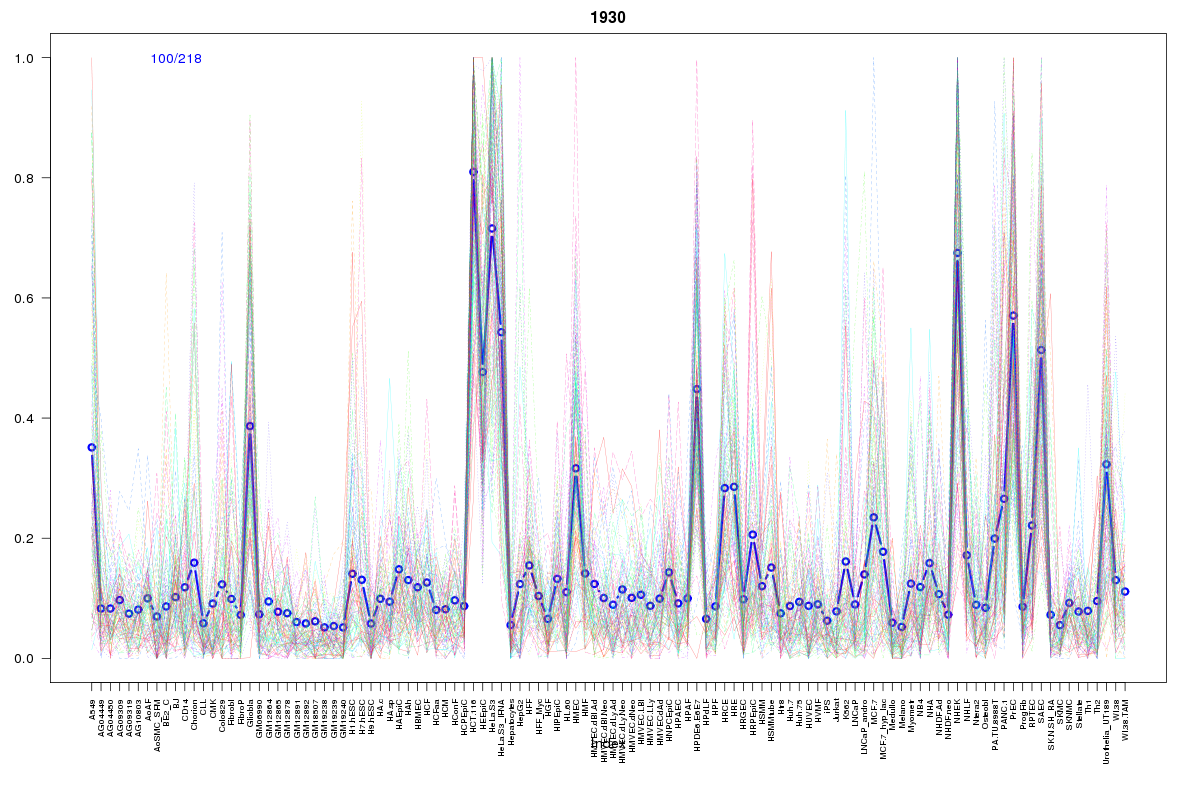
Cluster Hypersensitivity Profile

Genomic Location Trend
These plots show the distribution of the DHS sites surrounding the Transcript Start Site of the nearest gene.
Stats
Number of sites: 218Promoter: 7%
CpG-Island: 0%
Conserved: 25%
Enriched Motifs & Matches
Match Detail: [Jaspar]
|
| ||
|---|---|---|
| Sites: 38/100 | e-val: 1.4e-18 | ||
| Factor | e-val(match) | DB |
| AP1 | 0.00000000092191 | JASPAR |
| NFE2L2 | 0.0000000013186 | JASPAR |
| NFE2L1::MafG | 0.00058676 | JASPAR |
| Pax2 | 0.0032468 | JASPAR |
| PPARG | 0.0070137 | JASPAR |
BED file downloads
Top 10 Example Regions
| Location | Gene Link | Dist. |
|---|---|---|
| chr3: 45161960-45162110 | CDCP1 | 35.95 |
| chr9: 130483665-130483815 | PTRH1 | 36.35 |
| chr9: 130483665-130483815 | TOR2A | 36.35 |
| chr12: 30945640-30945790 | CAPRIN2 | 43.3 |
| chr9: 138844120-138844270 | UBAC1 | 45.06 |
| chr3: 149396260-149396410 | COMMD2 | 45.66 |
| chr1: 204026540-204026690 | SOX13 | 48.06 |
| chr8: 126137920-126138070 | NSMCE2 | 51.35 |
| chr9: 127581225-127581375 | GOLGA1 | 51.36 |
| chr9: 127581225-127581375 | RPL35 | 51.36 |