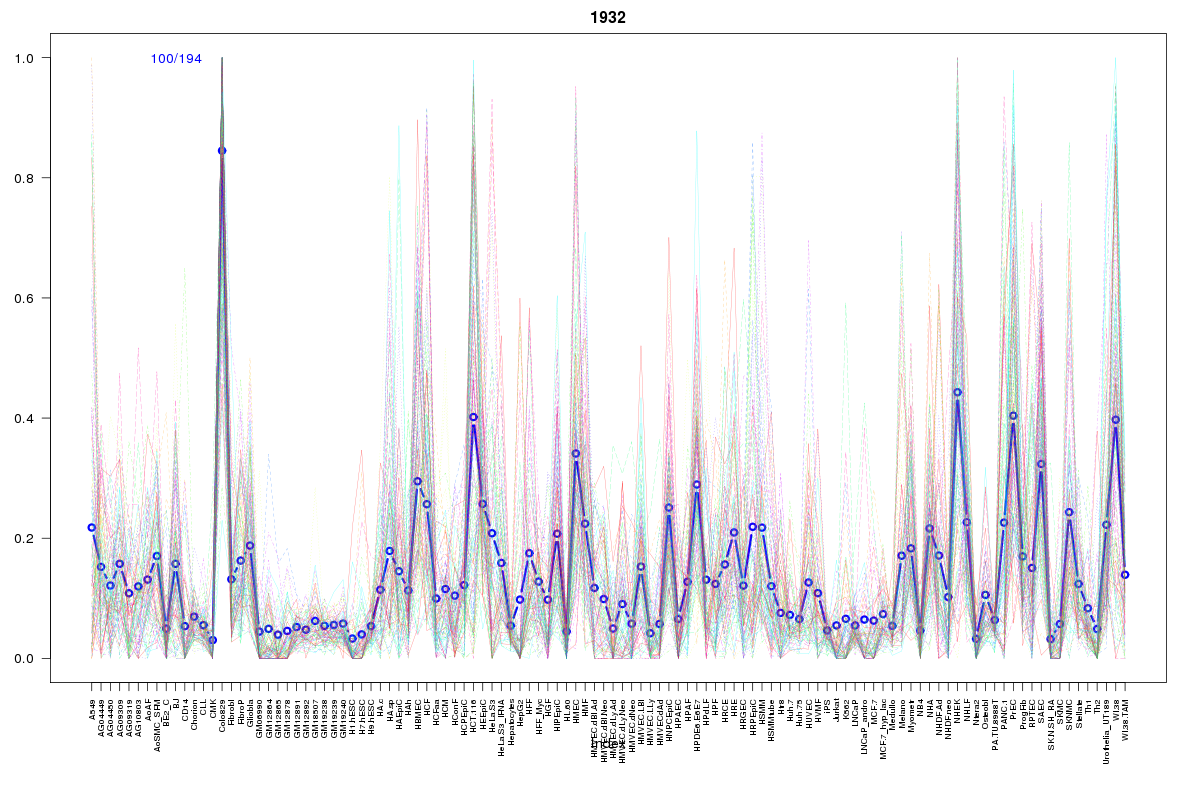
SOM cluster: 1932
Cluster Hypersensitivity Profile

Genomic Location Trend
These plots show the distribution of the DHS sites surrounding the Transcript Start Site of the nearest gene.
Stats
Number of sites: 194Promoter: 3%
CpG-Island: 0%
Conserved: 35%
Enriched Motifs & Matches
Match Detail: [Jaspar]
|
| ||
|---|---|---|
| Sites: 44/100 | e-val: 5e-20 | ||
| Factor | e-val(match) | DB |
| AP1 | 0.0000000029758 | JASPAR |
| NFE2L2 | 0.00000012892 | JASPAR |
| NFE2L1::MafG | 0.00026552 | JASPAR |
| PBX1 | 0.021088 | JASPAR |
| Pax2 | 0.037976 | JASPAR |
BED file downloads
Top 10 Example Regions
| Location | Gene Link | Dist. |
|---|---|---|
| chr1: 200693280-200693430 | CAMSAP2 | 50.03 |
| chr7: 65821625-65821775 | TPST1 | 51.9 |
| chr7: 55175760-55175910 | EGFR | 54.09 |
| chr4: 74688260-74688410 | IL8 | 55.22 |
| chr4: 74688260-74688410 | CXCL6 | 55.22 |
| chr4: 74688260-74688410 | CXCL1 | 55.22 |
| chr8: 19522440-19522590 | CSGALNACT1 | 57.03 |
| chr12: 76420120-76420270 | RP11-290L1.2 | 59.26 |
| chr12: 76420120-76420270 | PHLDA1 | 59.26 |
| chr12: 76420120-76420270 | NAP1L1 | 59.26 |