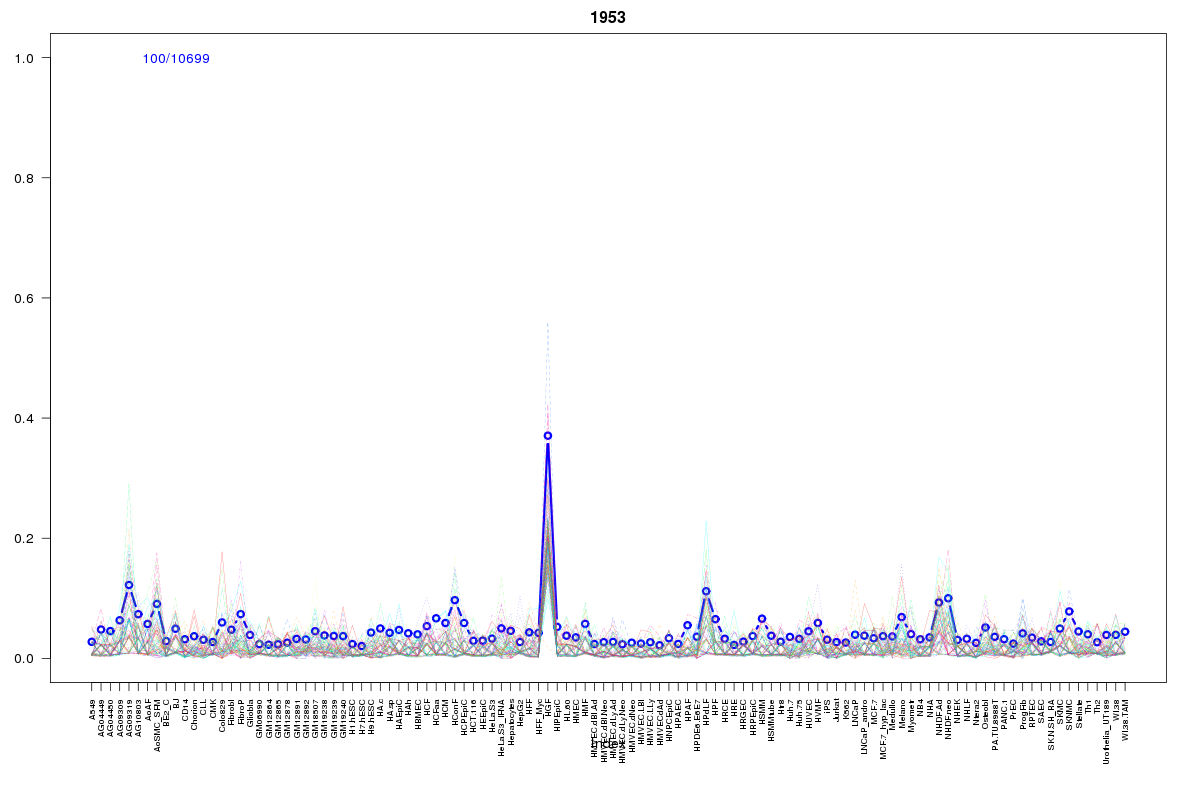
SOM cluster: 1953
Cluster Hypersensitivity Profile

Genomic Location Trend
These plots show the distribution of the DHS sites surrounding the Transcript Start Site of the nearest gene.
Stats
Number of sites: 10699Promoter: 0%
CpG-Island: 0%
Conserved: 15%
Enriched Motifs & Matches
Match Detail: [Jaspar]
|
| ||
|---|---|---|
| Sites: 24/100 | e-val: 0.00000000000028 | ||
| Factor | e-val(match) | DB |
| MEF2A | 0.000034503 | JASPAR |
| Foxd3 | 0.00028269 | JASPAR |
| Sox2 | 0.00030014 | JASPAR |
| Foxq1 | 0.00057365 | JASPAR |
| Pou5f1 | 0.00082354 | JASPAR |
BED file downloads
Top 10 Example Regions
| Location | Gene Link | Dist. |
|---|---|---|
| chr1: 65955280-65955430 | RP11-430H12.2 | 43.34 |
| chr8: 57424220-57424370 | SEPT10P1 | 44.99 |
| chr1: 60109400-60109550 | FGGY | 45.5 |
| chr1: 78935360-78935510 | PTGFR | 45.88 |
| chr3: 32132960-32133110 | snoU13 | 46.27 |
| chr1: 78214320-78214470 | USP33 | 48.67 |
| chr1: 202884480-202884630 | RP11-480I12.5 | 48.78 |
| chr2: 119985040-119985190 | STEAP3 | 49.6 |
| chr2: 119985040-119985190 | C1QL2 | 49.6 |
| chr9: 110140445-110140595 | RAD23B | 50.3 |