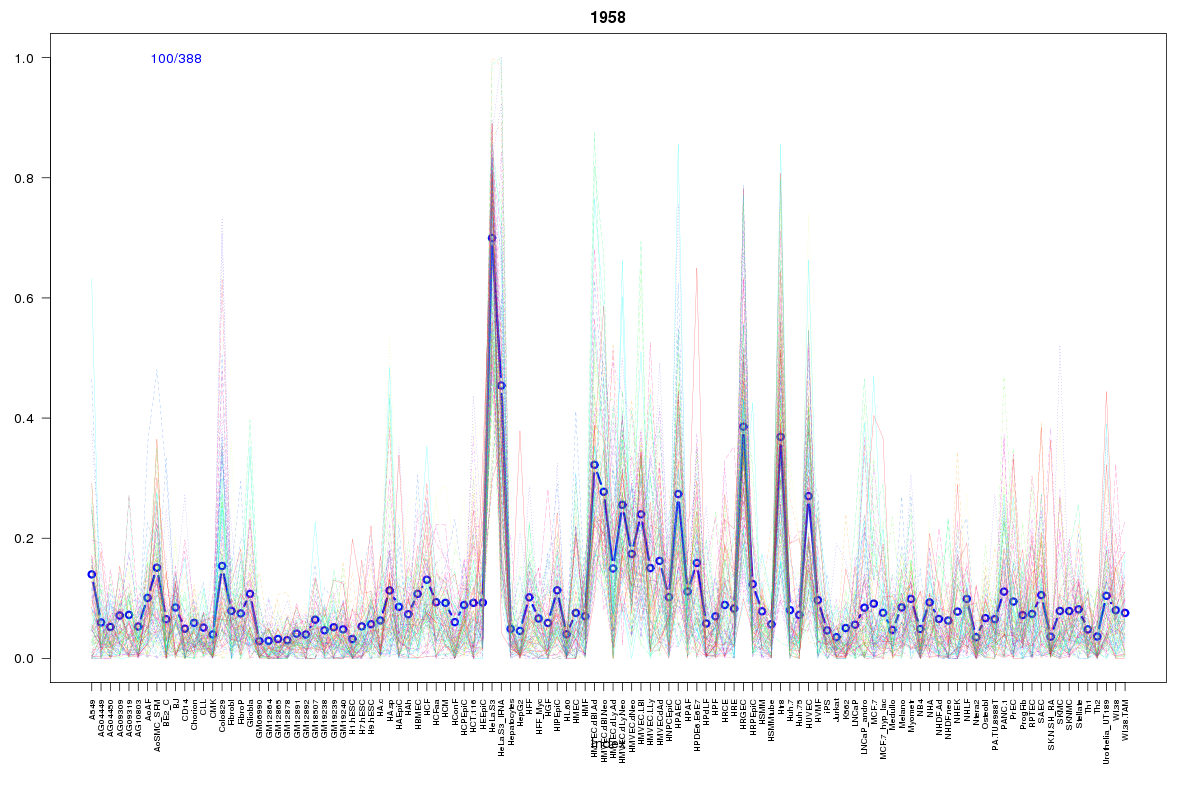
SOM cluster: 1958
Cluster Hypersensitivity Profile

Genomic Location Trend
These plots show the distribution of the DHS sites surrounding the Transcript Start Site of the nearest gene.
Stats
Number of sites: 388Promoter: 2%
CpG-Island: 0%
Conserved: 36%
Enriched Motifs & Matches
Match Detail: [Jaspar]
|
| ||
|---|---|---|
| Sites: 38/100 | e-val: 0.00013 | ||
| Factor | e-val(match) | DB |
| Foxq1 | 0.0012253 | JASPAR |
| Lhx3 | 0.003989 | JASPAR |
| HNF1B | 0.0058588 | JASPAR |
| NFATC2 | 0.0092454 | JASPAR |
| HNF1A | 0.010357 | JASPAR |
BED file downloads
Top 10 Example Regions
| Location | Gene Link | Dist. |
|---|---|---|
| chr11: 16808860-16809010 | SOX6 | 46.01 |
| chr8: 55318080-55318230 | SOX17 | 48.56 |
| chr1: 162375700-162375850 | C1orf226 | 51.06 |
| chr9: 125026380-125026530 | LHX6 | 54.34 |
| chr20: 33723640-33723790 | PROCR | 62.13 |
| chr20: 33723640-33723790 | EDEM2 | 62.13 |
| chr11: 62390060-62390210 | EEF1G | 65.11 |
| chr11: 62390060-62390210 | LRRN4CL | 65.11 |
| chr3: 171430440-171430590 | PLD1 | 71.68 |
| chr3: 171430440-171430590 | PP13439 | 71.68 |