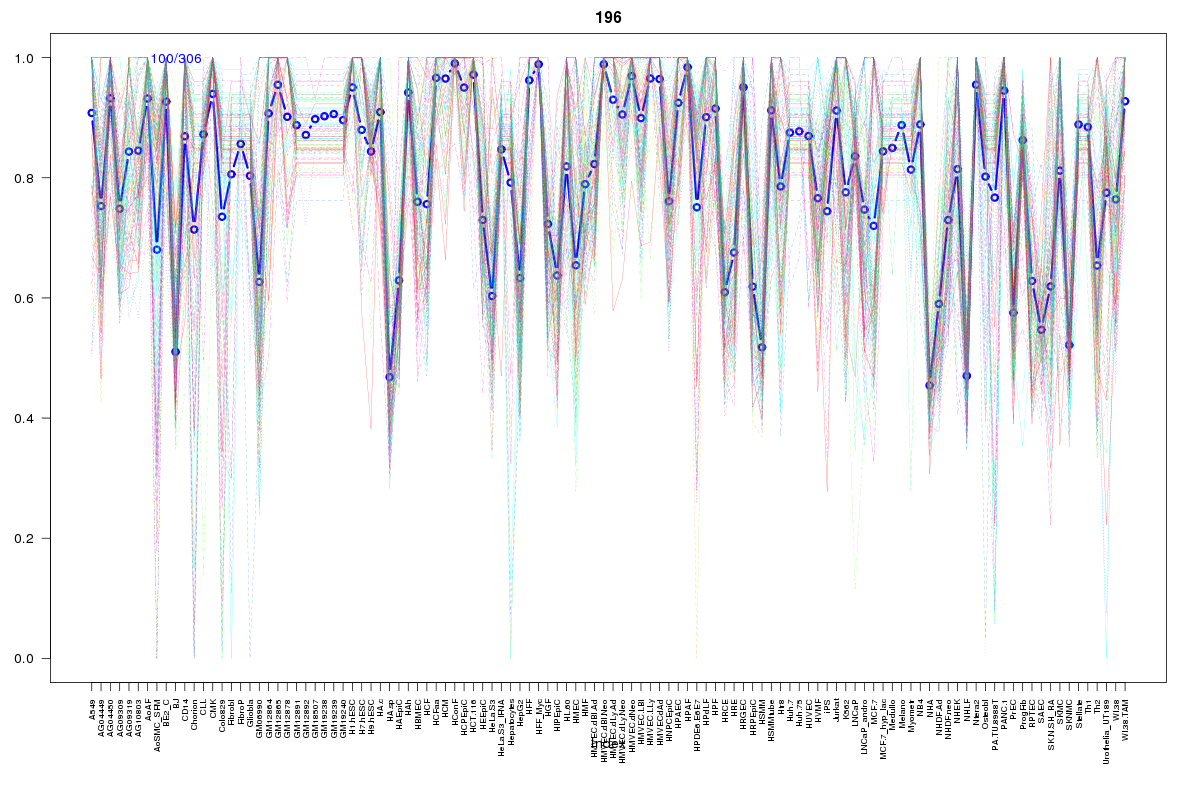
SOM cluster: 196
Cluster Hypersensitivity Profile

Genomic Location Trend
These plots show the distribution of the DHS sites surrounding the Transcript Start Site of the nearest gene.
Stats
Number of sites: 306Promoter: 10%
CpG-Island: 0%
Conserved: 83%
Enriched Motifs & Matches
Match Detail: [Jaspar]
|
| ||
|---|---|---|
| Sites: 99/100 | e-val: 0 | ||
| Factor | e-val(match) | DB |
| CTCF | 0 | JASPAR |
| INSM1 | 0.0000005857 | JASPAR |
| MYC::MAX | 0.0014253 | JASPAR |
| SP1 | 0.0029912 | JASPAR |
| Zfp423 | 0.005417 | JASPAR |
|
| ||
| Sites: 23/100 | e-val: 0.00017 | ||
| Factor | e-val(match) | DB |
| INSM1 | 0.014662 | JASPAR |
| Myf | 0.019563 | JASPAR |
| TLX1::NFIC | 0.023559 | JASPAR |
| Hand1::Tcfe2a | 0.02749 | JASPAR |
| NFKB1 | 0.038767 | JASPAR |
BED file downloads
Top 10 Example Regions
| Location | Gene Link | Dist. |
|---|---|---|
| chr17: 2319440-2319590 | TSR1 | 43.96 |
| chr16: 30609580-30609730 | PRR14 | 55.66 |
| chr8: 42270020-42270170 | DKK4 | 59.44 |
| chr8: 42270020-42270170 | RP11-1007J8.1 | 59.44 |
| chr8: 42270020-42270170 | SLC20A2 | 59.44 |
| chr19: 45454920-45455070 | TOMM40 | 63.01 |
| chr9: 35790420-35790570 | FAM221B | 63.97 |
| chr9: 35790420-35790570 | RP11-112J3.16 | 63.97 |
| chr17: 38170080-38170230 | ORMDL3 | 64.37 |
| chr19: 4724680-4724830 | TNFAIP8L1 | 65.67 |