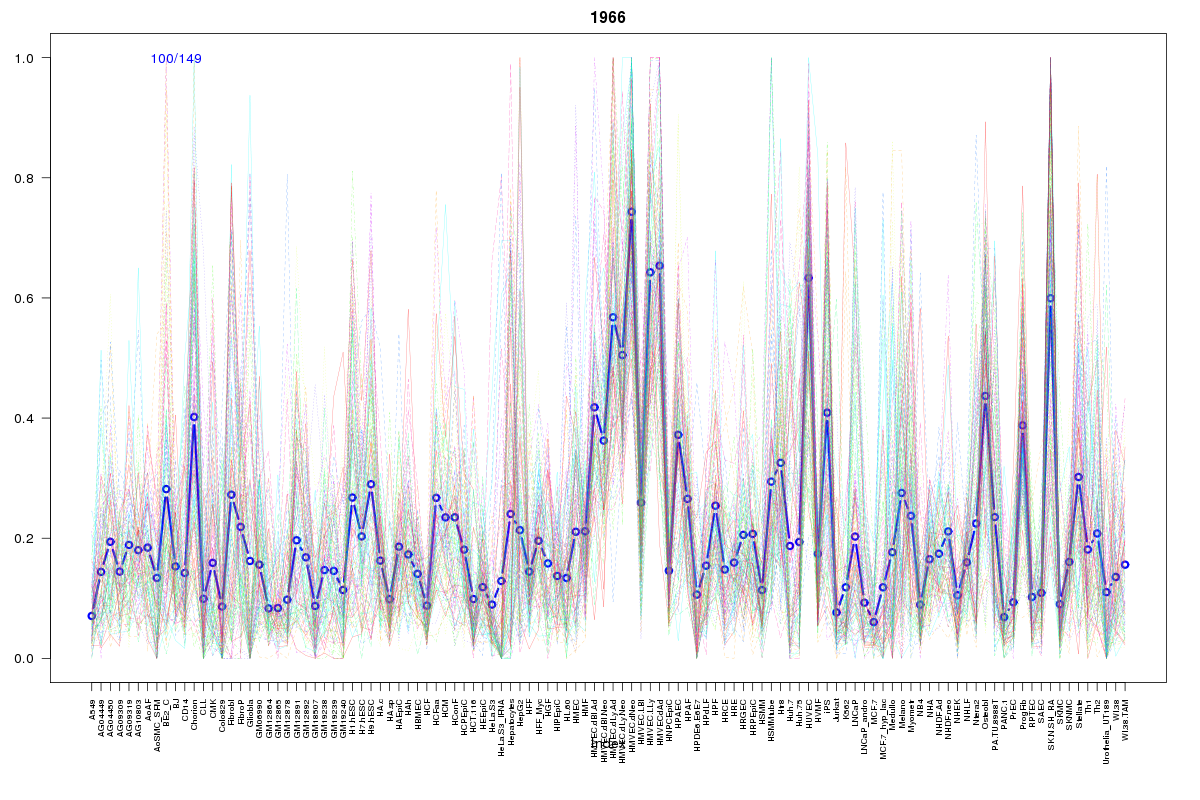
SOM cluster: 1966
Cluster Hypersensitivity Profile

Genomic Location Trend
These plots show the distribution of the DHS sites surrounding the Transcript Start Site of the nearest gene.
Stats
Number of sites: 149Promoter: 27%
CpG-Island: 68%
Conserved: 70%
Enriched Motifs & Matches
Match Detail: [Jaspar]
|
| ||
|---|---|---|
| Sites: 100/100 | e-val: 0 | ||
| Factor | e-val(match) | DB |
| SP1 | 0.00022509 | JASPAR |
| Klf4 | 0.0042246 | JASPAR |
| Egr1 | 0.0066731 | JASPAR |
| Zfx | 0.02065 | JASPAR |
| TFAP2A | 0.044373 | JASPAR |
|
| ||
| Sites: 94/100 | e-val: 1.2e-27 | ||
| Factor | e-val(match) | DB |
| TFAP2A | 0.00080529 | JASPAR |
| SP1 | 0.0015739 | JASPAR |
| E2F1 | 0.0078764 | JASPAR |
| PLAG1 | 0.023244 | JASPAR |
| Myb | 0.043124 | JASPAR |
BED file downloads
Top 10 Example Regions
| Location | Gene Link | Dist. |
|---|---|---|
| chr9: 130616540-130616690 | RP11-228B15.4 | 43.21 |
| chr9: 130616540-130616690 | ENG | 43.21 |
| chr16: 4390080-4390230 | DNAJA3 | 49.44 |
| chr1: 66999500-66999650 | SGIP1 | 54.84 |
| chr17: 1965940-1966090 | HIC1 | 56.15 |
| chr8: 10587300-10587450 | CTD-2135J3.3 | 58.21 |
| chr15: 91500340-91500490 | RCCD1 | 62.16 |
| chr20: 33146740-33146890 | ITCH | 65.96 |
| chr20: 33146740-33146890 | MAP1LC3A | 65.96 |
| chr7: 131242925-131243075 | PODXL | 68.77 |