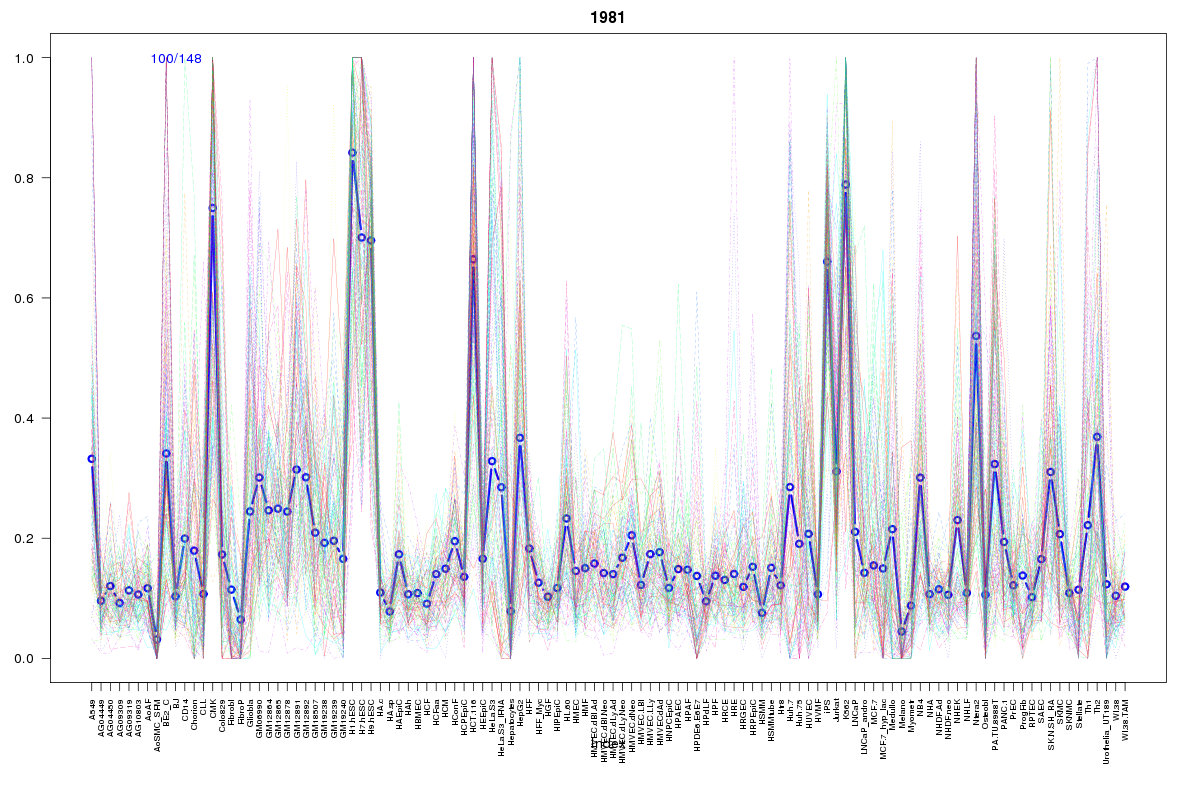
SOM cluster: 1981
Cluster Hypersensitivity Profile

Genomic Location Trend
These plots show the distribution of the DHS sites surrounding the Transcript Start Site of the nearest gene.
Stats
Number of sites: 148Promoter: 15%
CpG-Island: 16%
Conserved: 41%
Enriched Motifs & Matches
Match Detail: [Jaspar]
|
| ||
|---|---|---|
| Sites: 83/100 | e-val: 0 | ||
| Factor | e-val(match) | DB |
| SP1 | 0.0000000083416 | JASPAR |
| Klf4 | 0.000000012124 | JASPAR |
| PLAG1 | 0.000000047322 | JASPAR |
| TFAP2A | 0.00039974 | JASPAR |
| RREB1 | 0.00042843 | JASPAR |
|
| ||
| Sites: 68/100 | e-val: 3.7e-40 | ||
| Factor | e-val(match) | DB |
| Klf4 | 0.00000000006815 | JASPAR |
| SP1 | 0.00000029027 | JASPAR |
| Zfx | 0.0047117 | JASPAR |
| Egr1 | 0.007579 | JASPAR |
| PLAG1 | 0.017835 | JASPAR |
|
| ||
| Sites: 36/100 | e-val: 0.000000000000013 | ||
| Factor | e-val(match) | DB |
| SP1 | 0.00000000000011857 | JASPAR |
| Klf4 | 0.00000000082381 | JASPAR |
| Egr1 | 0.00034302 | JASPAR |
| INSM1 | 0.0013546 | JASPAR |
| PPARG::RXRA | 0.0056325 | JASPAR |
BED file downloads
Top 10 Example Regions
| Location | Gene Link | Dist. |
|---|---|---|
| chr19: 48824060-48824210 | CCDC114 | 31.12 |
| chr19: 50880600-50880750 | POLD1 | 54.98 |
| chr19: 49240780-49240930 | FUT1 | 59.1 |
| chr19: 49540200-49540350 | SNRNP70 | 60.27 |
| chr19: 49540200-49540350 | RUVBL2 | 60.27 |
| chr19: 49929600-49929750 | FCGRT | 62.79 |
| chr19: 49929600-49929750 | RPL13A | 62.79 |
| chr19: 49929600-49929750 | SNORD32A | 62.79 |
| chr19: 49929600-49929750 | FLT3LG | 62.79 |
| chrX: 102509280-102509430 | TCEAL8 | 64.25 |