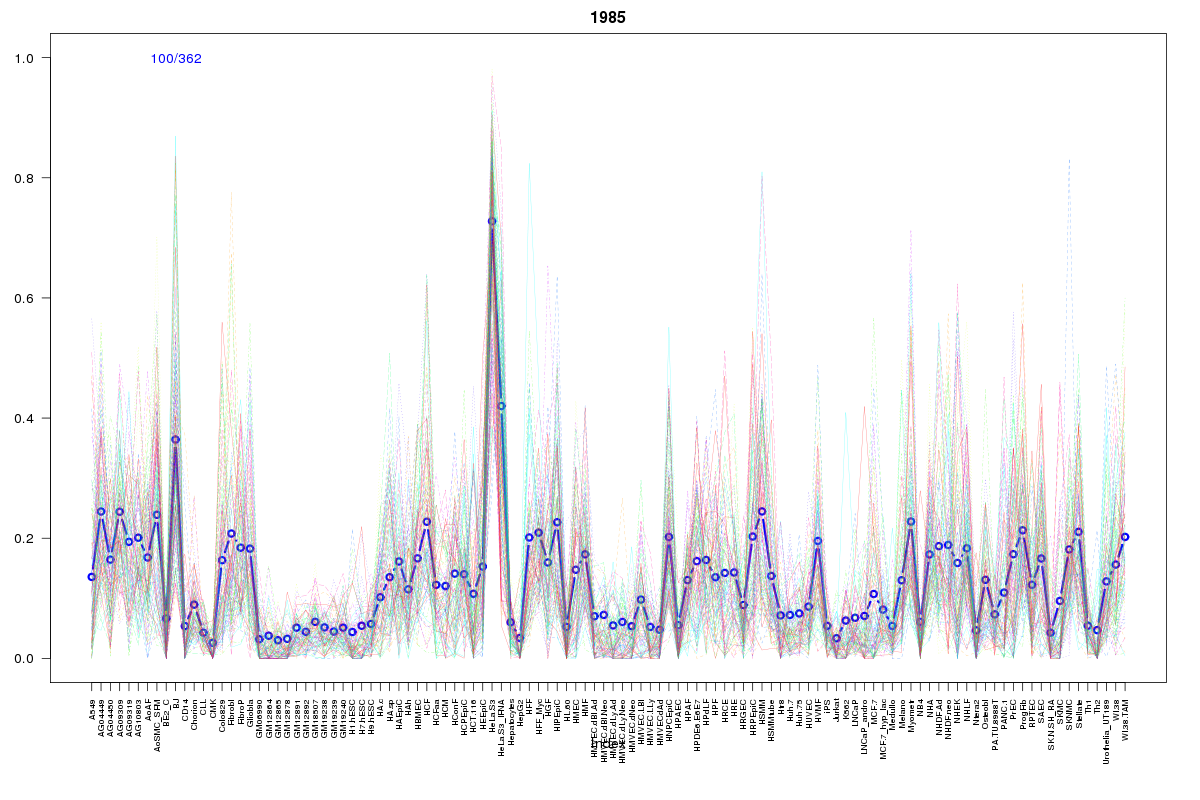
SOM cluster: 1985
Cluster Hypersensitivity Profile

Genomic Location Trend
These plots show the distribution of the DHS sites surrounding the Transcript Start Site of the nearest gene.
Stats
Number of sites: 362Promoter: 1%
CpG-Island: 0%
Conserved: 20%
Enriched Motifs & Matches
Match Detail: [Jaspar]
|
| ||
|---|---|---|
| Sites: 47/100 | e-val: 0.0000000000074 | ||
| Factor | e-val(match) | DB |
| MEF2A | 0.00011081 | JASPAR |
| Foxq1 | 0.00021277 | JASPAR |
| HNF1B | 0.00067251 | JASPAR |
| Foxd3 | 0.00072522 | JASPAR |
| NKX3-1 | 0.002288 | JASPAR |