SOM cluster: 199
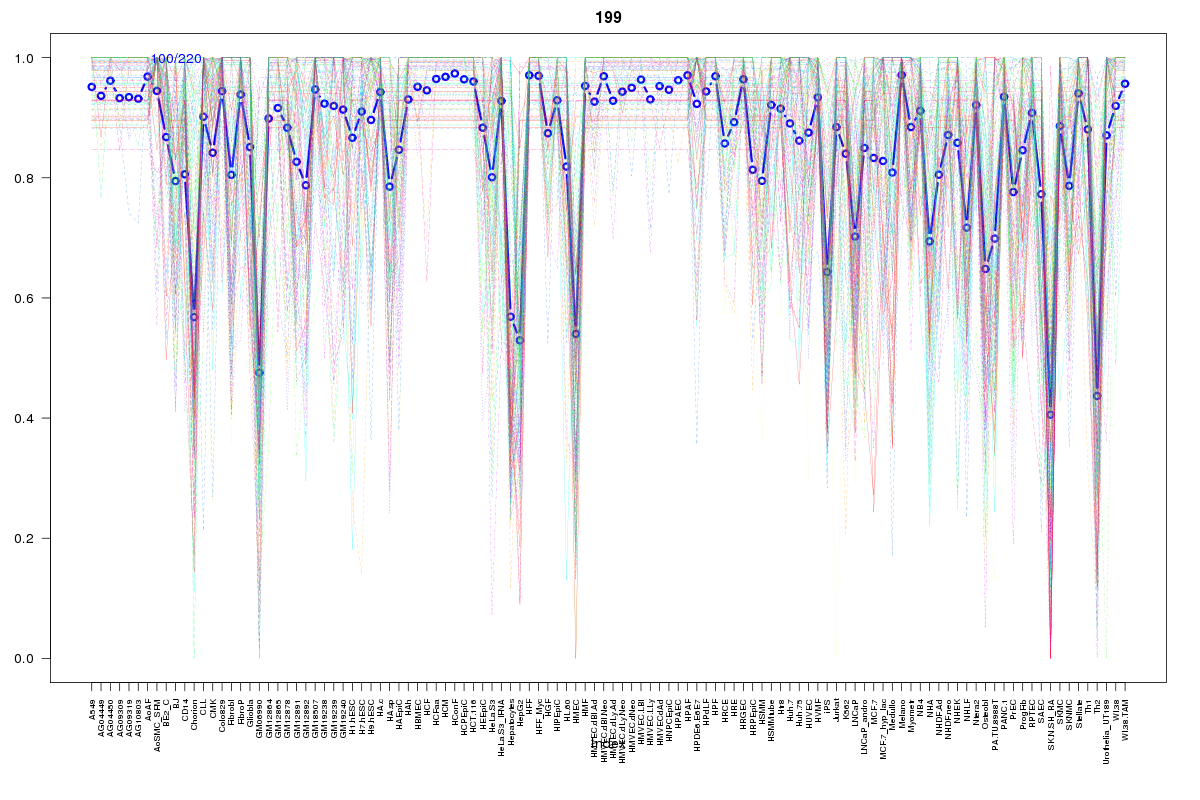
Cluster Hypersensitivity Profile

Genomic Location Trend
These plots show the distribution of the DHS sites surrounding the Transcript Start Site of the nearest gene.
Stats
Number of sites: 220Promoter: 24%
CpG-Island: 8%
Conserved: 82%
Enriched Motifs & Matches
Match Detail: [Jaspar]
|
| ||
|---|---|---|
| Sites: 77/100 | e-val: 0 | ||
| Factor | e-val(match) | DB |
| CTCF | 0.00000000000031297 | JASPAR |
| INSM1 | 0.0014117 | JASPAR |
| TAL1::TCF3 | 0.0043249 | JASPAR |
| Zfp423 | 0.0074162 | JASPAR |
| MYC::MAX | 0.019861 | JASPAR |
BED file downloads
Top 10 Example Regions
| Location | Gene Link | Dist. |
|---|---|---|
| chr3: 129209180-129209330 | H1FOO | 32.77 |
| chr3: 129209180-129209330 | PLXND1 | 32.77 |
| chr1: 203595720-203595870 | ATP2B4 | 41.18 |
| chr3: 160117280-160117430 | MIR16-2 | 48.79 |
| chr17: 40669700-40669850 | COASY | 54.56 |
| chr17: 40669700-40669850 | PSMC3IP | 54.56 |
| chr1: 115681680-115681830 | RP4-666F24.3 | 57.66 |
| chr1: 178001100-178001250 | RP11-568K15.1 | 60.54 |
| chr3: 37254640-37254790 | LRRFIP2 | 62.11 |
| chr12: 109197360-109197510 | DAO | 68.53 |