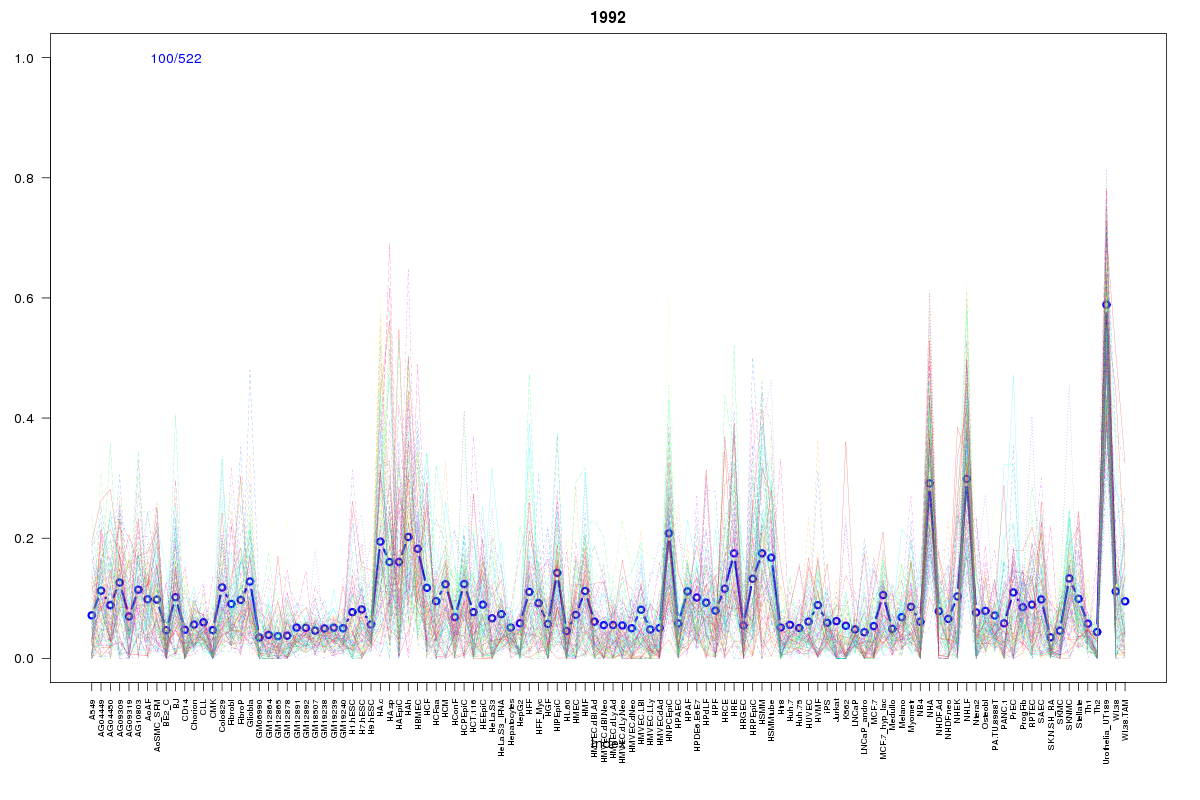
SOM cluster: 1992
Cluster Hypersensitivity Profile

Genomic Location Trend
These plots show the distribution of the DHS sites surrounding the Transcript Start Site of the nearest gene.
Stats
Number of sites: 522Promoter: 1%
CpG-Island: 0%
Conserved: 16%
Enriched Motifs & Matches
Match Detail: [Jaspar]
|
| ||
|---|---|---|
| Sites: 22/100 | e-val: 0.0042 | ||
| Factor | e-val(match) | DB |
| AP1 | 0.00000020405 | JASPAR |
| NFE2L2 | 0.000008445 | JASPAR |
| PBX1 | 0.0031764 | JASPAR |
| Lhx3 | 0.014326 | JASPAR |
| RUNX1 | 0.035383 | JASPAR |
BED file downloads
Top 10 Example Regions
| Location | Gene Link | Dist. |
|---|---|---|
| chr19: 35451205-35451355 | ZNF30 | 32.83 |
| chr5: 133206305-133206455 | C5orf15 | 34.09 |
| chr5: 131437905-131438055 | CSF2 | 54.25 |
| chr3: 170627060-170627210 | EIF5A2 | 54.66 |
| chr9: 131908785-131908935 | IER5L | 57.57 |
| chr8: 9039120-9039270 | PPP1R3B | 58.04 |
| chr8: 9039120-9039270 | RP11-10A14.5 | 58.04 |
| chrX: 100937840-100937990 | ARMCX2 | 61.29 |
| chr22: 20924025-20924175 | KLHL22 | 62.64 |
| chr10: 12436760-12436910 | CAMK1D | 63.41 |