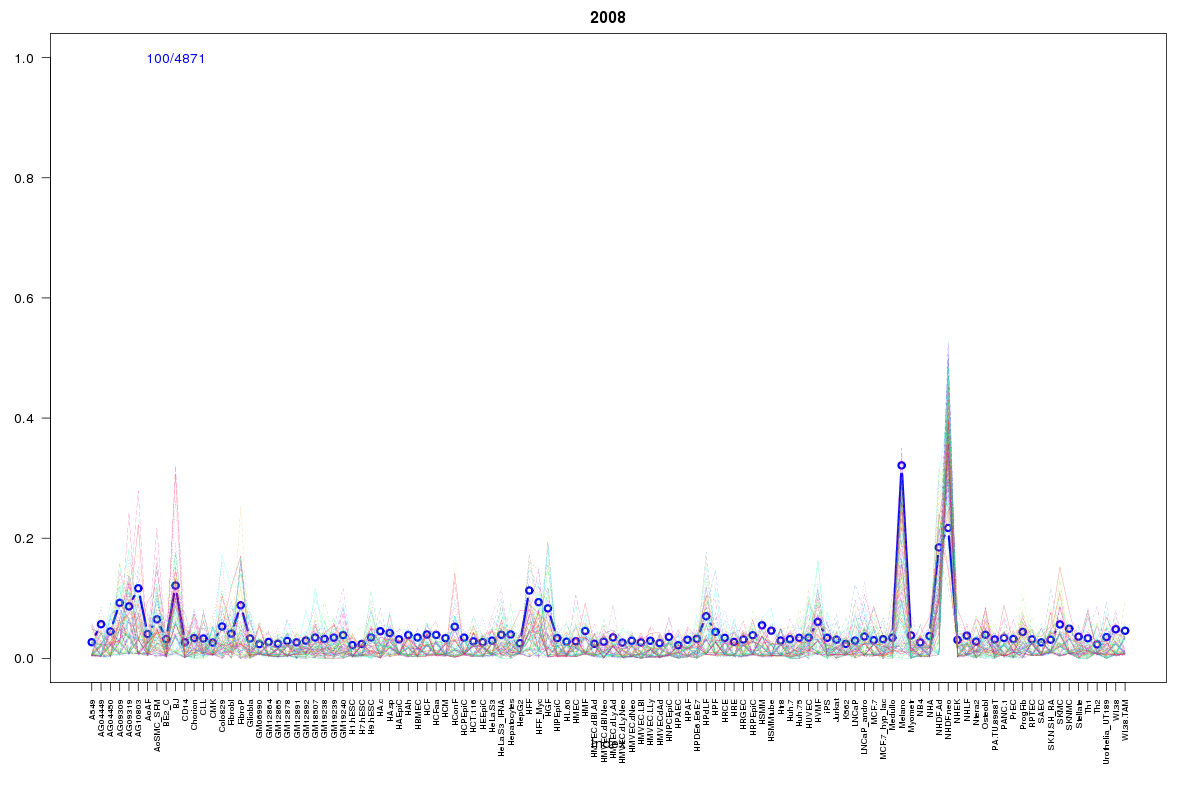
SOM cluster: 2008
Cluster Hypersensitivity Profile

Genomic Location Trend
These plots show the distribution of the DHS sites surrounding the Transcript Start Site of the nearest gene.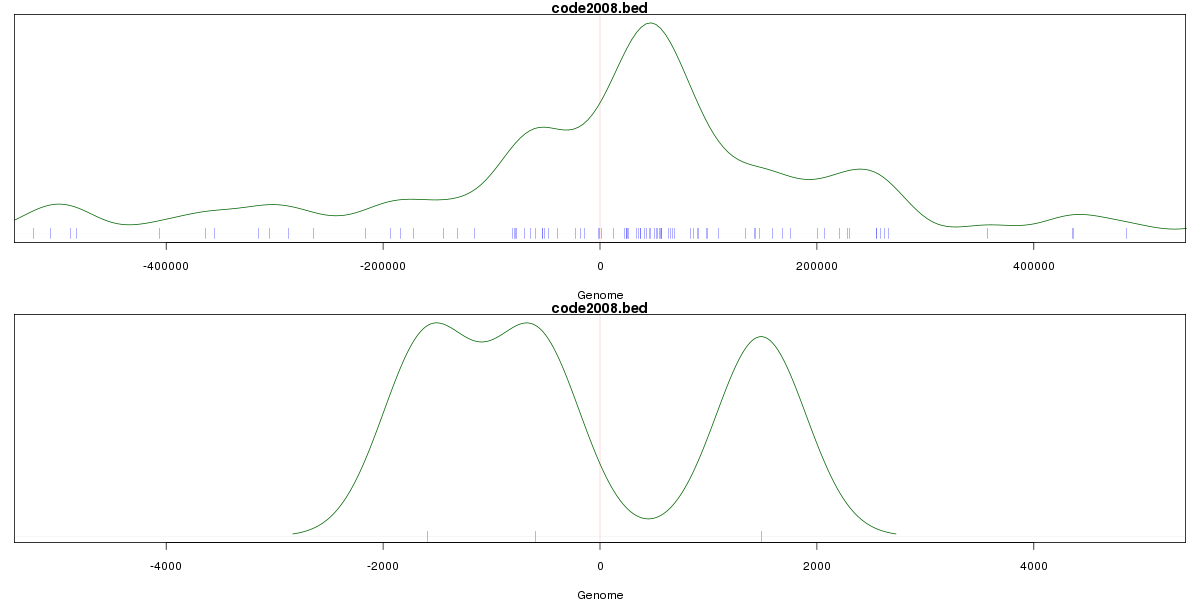
Stats
Number of sites: 4871Promoter: 2%
CpG-Island: 0%
Conserved: 51%
Enriched Motifs & Matches
Match Detail: [Jaspar]
|
| ||
|---|---|---|
| Sites: 57/100 | e-val: 5.3e-28 | ||
| Factor | e-val(match) | DB |
| Foxq1 | 0.0000078505 | JASPAR |
| Foxd3 | 0.000016512 | JASPAR |
| MEF2A | 0.000081311 | JASPAR |
| Pax4 | 0.00042542 | JASPAR |
| Pou5f1 | 0.00053962 | JASPAR |
|
| ||
| Sites: 41/100 | e-val: 0.000000000016 | ||
| Factor | e-val(match) | DB |
| TAL1::TCF3 | 0.000024374 | JASPAR |
| HNF1A | 0.00032496 | JASPAR |
| ARID3A | 0.001574 | JASPAR |
| Lhx3 | 0.0020583 | JASPAR |
| Foxd3 | 0.0029096 | JASPAR |
BED file downloads
Top 10 Example Regions
| Location | Gene Link | Dist. |
|---|---|---|
| chr18: 13645740-13645890 | RN7SL362P | 38.91 |
| chrX: 10186520-10186670 | CLCN4 | 42.92 |
| chr3: 152953160-152953310 | RAP2B | 44.59 |
| chr9: 110584580-110584730 | RN7SL659P | 50.33 |
| chr3: 46122540-46122690 | XCR1 | 50.68 |
| chr8: 49705885-49706035 | RP11-770E5.1 | 54.27 |
| chr3: 13597740-13597890 | FBLN2 | 54.37 |
| chr3: 155206580-155206730 | PLCH1-AS1 | 57.27 |
| chr1: 31159480-31159630 | MATN1-AS1 | 58.18 |
| chr13: 111770325-111770475 | ARHGEF7-IT1 | 58.38 |