SOM cluster: 201
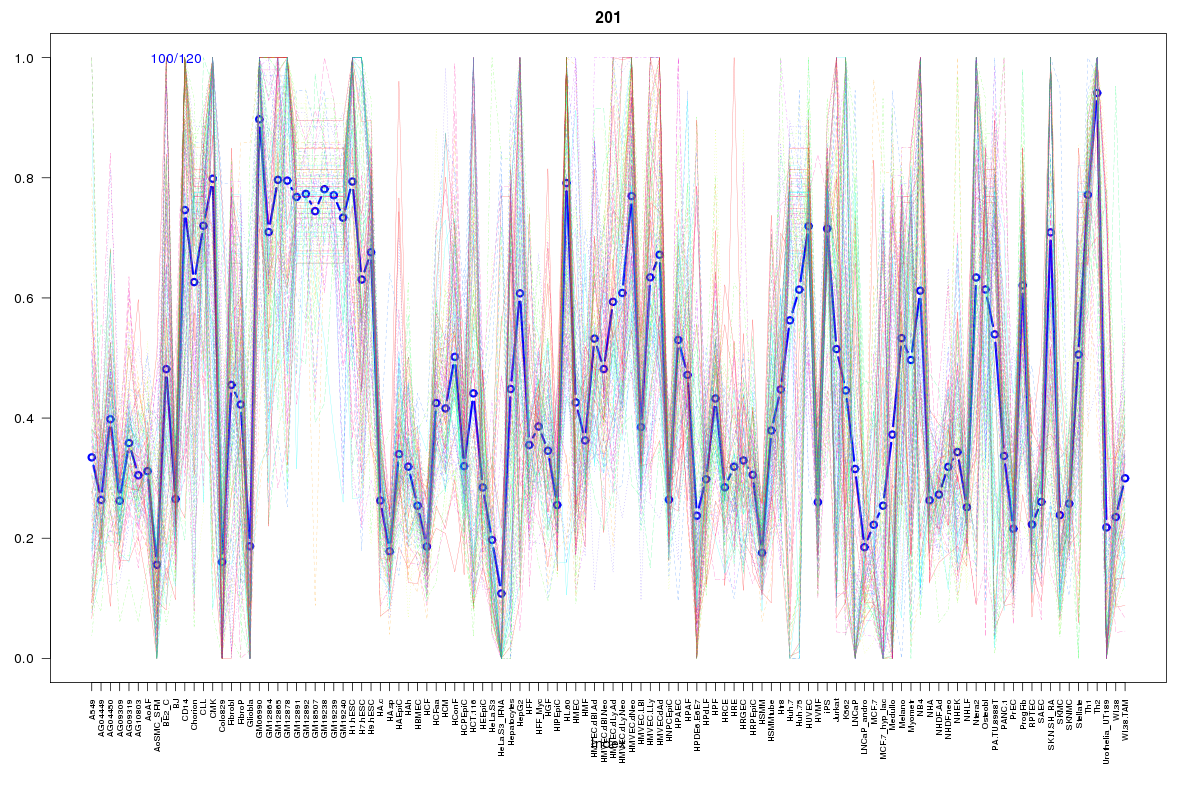
Cluster Hypersensitivity Profile

Genomic Location Trend
These plots show the distribution of the DHS sites surrounding the Transcript Start Site of the nearest gene.
Stats
Number of sites: 120Promoter: 27%
CpG-Island: 80%
Conserved: 61%
Enriched Motifs & Matches
Match Detail: [Jaspar]
|
| ||
|---|---|---|
| Sites: 94/100 | e-val: 0 | ||
| Factor | e-val(match) | DB |
| SP1 | 0.00011325 | JASPAR |
| TFAP2A | 0.0014299 | JASPAR |
| Egr1 | 0.0048093 | JASPAR |
| Zfx | 0.034554 | JASPAR |
| CTCF | 0.036486 | JASPAR |
|
| ||
| Sites: 83/100 | e-val: 5.8e-19 | ||
| Factor | e-val(match) | DB |
| TFAP2A | 0.00022305 | JASPAR |
| SP1 | 0.0097152 | JASPAR |
| Klf4 | 0.030152 | JASPAR |
| NHLH1 | 0.042691 | JASPAR |
| PLAG1 | 0.072702 | JASPAR |
BED file downloads
Top 10 Example Regions
| Location | Gene Link | Dist. |
|---|---|---|
| chr1: 28198980-28199130 | THEMIS2 | 59.69 |
| chr1: 45251960-45252110 | KIF2C | 59.89 |
| chr1: 45251960-45252110 | TCTEX1D4 | 59.89 |
| chr1: 45251960-45252110 | PTCH2 | 59.89 |
| chr1: 45251960-45252110 | SNORD38A | 59.89 |
| chr1: 45251960-45252110 | RPS8 | 59.89 |
| chr3: 196366520-196366670 | NRROS | 59.91 |
| chr3: 196366520-196366670 | WDR53 | 59.91 |
| chr3: 196366520-196366670 | LINC01063 | 59.91 |
| chr7: 100273620-100273770 | GNB2 | 60.23 |