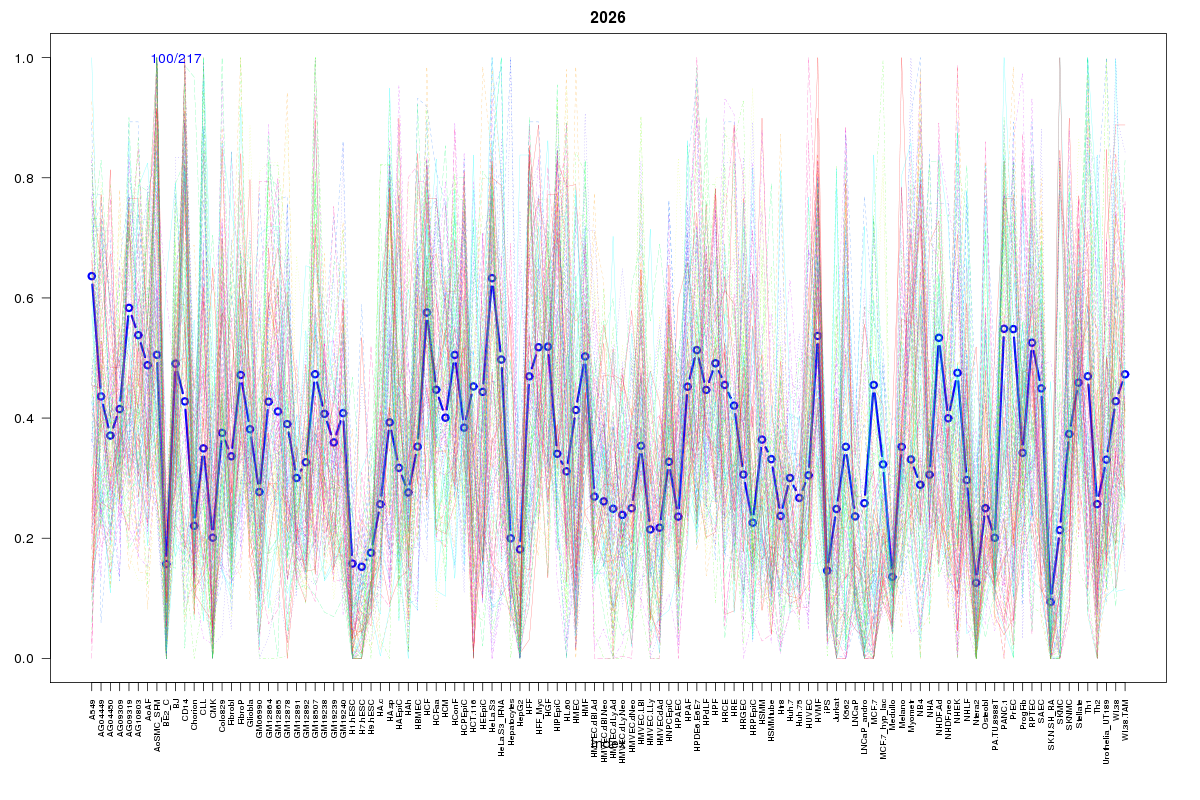
SOM cluster: 2026
Cluster Hypersensitivity Profile

Genomic Location Trend
These plots show the distribution of the DHS sites surrounding the Transcript Start Site of the nearest gene.
Stats
Number of sites: 217Promoter: 20%
CpG-Island: 3%
Conserved: 41%
Enriched Motifs & Matches
Match Detail: [Jaspar]
|
| ||
|---|---|---|
| Sites: 19/100 | e-val: 0.00016 | ||
| Factor | e-val(match) | DB |
| Foxd3 | 0.00073011 | JASPAR |
| MEF2A | 0.00097701 | JASPAR |
| FOXF2 | 0.0010611 | JASPAR |
| FOXA1 | 0.0010917 | JASPAR |
| Foxq1 | 0.0031518 | JASPAR |
|
| ||
| Sites: 36/100 | e-val: 0.0028 | ||
| Factor | e-val(match) | DB |
| AP1 | 0.000000000080734 | JASPAR |
| NFE2L2 | 0.0000000049501 | JASPAR |
| PPARG | 0.00421 | JASPAR |
| NFE2L1::MafG | 0.0044054 | JASPAR |
| Foxa2 | 0.015416 | JASPAR |
BED file downloads
Top 10 Example Regions
| Location | Gene Link | Dist. |
|---|---|---|
| chr11: 18405720-18405870 | TSG101 | 44.31 |
| chr11: 18405720-18405870 | LDHA | 44.31 |
| chr17: 73032860-73033010 | AC111186.1 | 44.54 |
| chr19: 16189360-16189510 | TPM4 | 50.94 |
| chr8: 54857365-54857515 | RP11-30L15.4 | 53.5 |
| chr9: 130503060-130503210 | SH2D3C | 54.59 |
| chr11: 65275520-65275670 | LTBP3 | 54.83 |
| chr10: 89521760-89521910 | ATAD1 | 57.48 |
| chr3: 148963660-148963810 | TM4SF18 | 57.65 |
| chr1: 235324820-235324970 | RP4-597N16.1 | 65.23 |