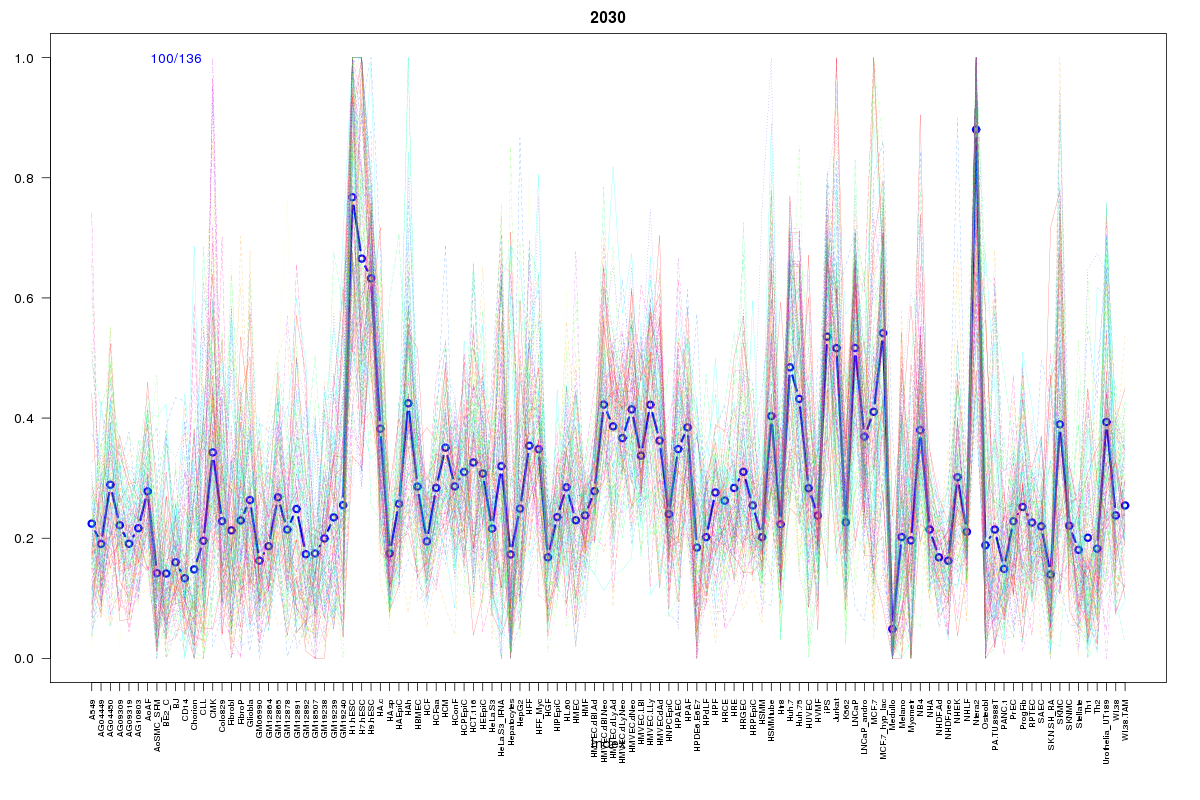
SOM cluster: 2030
Cluster Hypersensitivity Profile

Genomic Location Trend
These plots show the distribution of the DHS sites surrounding the Transcript Start Site of the nearest gene.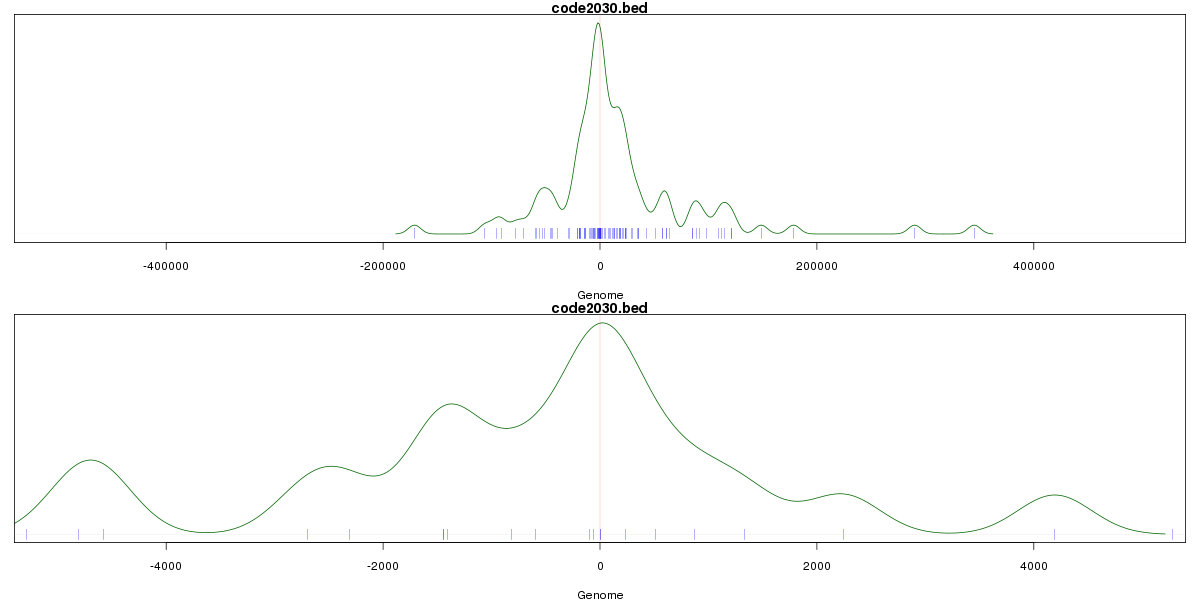
Stats
Number of sites: 136Promoter: 8%
CpG-Island: 4%
Conserved: 85%
Enriched Motifs & Matches
Match Detail: [Jaspar]
|
| ||
|---|---|---|
| Sites: 85/100 | e-val: 0 | ||
| Factor | e-val(match) | DB |
| REST | 0 | JASPAR |
| RXR::RAR_DR5 | 0.0008342 | JASPAR |
| TLX1::NFIC | 0.0054849 | JASPAR |
| SOX9 | 0.031157 | JASPAR |
| Mafb | 0.035054 | JASPAR |
|
| ||
| Sites: 47/100 | e-val: 3e-24 | ||
| Factor | e-val(match) | DB |
| SP1 | 0.000000066498 | JASPAR |
| EWSR1-FLI1 | 0.0000002183 | JASPAR |
| Pax4 | 0.00094935 | JASPAR |
| RREB1 | 0.0016824 | JASPAR |
| Klf4 | 0.011419 | JASPAR |
|
| ||
| Sites: 21/100 | e-val: 0.013 | ||
| Factor | e-val(match) | DB |
| REST | 0.00000000030603 | JASPAR |
| Myf | 0.00094299 | JASPAR |
| REL | 0.0037441 | JASPAR |
| NHLH1 | 0.010854 | JASPAR |
| NF-kappaB | 0.028005 | JASPAR |
BED file downloads
Top 10 Example Regions
| Location | Gene Link | Dist. |
|---|---|---|
| chr8: 144183305-144183455 | C8orf31 | 36.36 |
| chr8: 144183305-144183455 | LY6E | 36.36 |
| chr5: 176231040-176231190 | HK3 | 49.14 |
| chr11: 119389640-119389790 | USP2-AS1 | 57.21 |
| chr17: 57243460-57243610 | SKA2 | 63.03 |
| chr11: 122852545-122852695 | SNORD14C | 67.98 |
| chr22: 23746960-23747110 | AP000344.3 | 75.04 |
| chr22: 23746960-23747110 | KB-1269D1.8 | 75.04 |
| chr9: 79075400-79075550 | GCNT1 | 76.62 |
| chr2: 119924760-119924910 | STEAP3 | 77.23 |