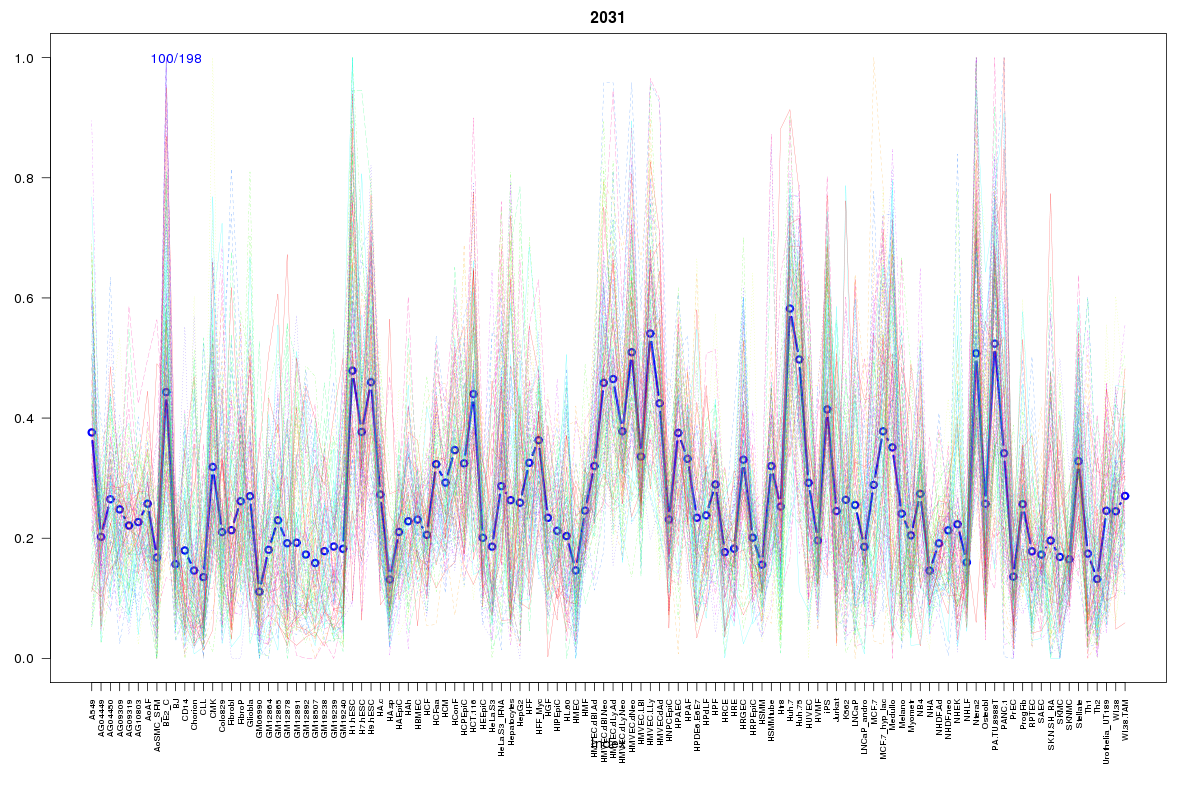
SOM cluster: 2031
Cluster Hypersensitivity Profile

Genomic Location Trend
These plots show the distribution of the DHS sites surrounding the Transcript Start Site of the nearest gene.
Stats
Number of sites: 198Promoter: 6%
CpG-Island: 2%
Conserved: 41%
Enriched Motifs & Matches
Match Detail: [Jaspar]
|
| ||
|---|---|---|
| Sites: 67/100 | e-val: 0 | ||
| Factor | e-val(match) | DB |
| CTCF | 0.00000000000035405 | JASPAR |
| INSM1 | 0.00011105 | JASPAR |
| MYC::MAX | 0.0016293 | JASPAR |
| Zfp423 | 0.0060315 | JASPAR |
| MZF1_5-13 | 0.021355 | JASPAR |
|
| ||
| Sites: 17/100 | e-val: 0.23 | ||
| Factor | e-val(match) | DB |
| Myf | 0.000042202 | JASPAR |
| NHLH1 | 0.0038663 | JASPAR |
| Spz1 | 0.0062216 | JASPAR |
| NFATC2 | 0.013608 | JASPAR |
| NFKB1 | 0.05786 | JASPAR |
|
| ||
| Sites: 28/100 | e-val: 2.1 | ||
| Factor | e-val(match) | DB |
| SP1 | 0.0000000034824 | JASPAR |
| Pax4 | 0.000068686 | JASPAR |
| Tcfcp2l1 | 0.00090602 | JASPAR |
| Tal1::Gata1 | 0.0011688 | JASPAR |
| MZF1_5-13 | 0.0046376 | JASPAR |
BED file downloads
Top 10 Example Regions
| Location | Gene Link | Dist. |
|---|---|---|
| chr7: 111845540-111845690 | DOCK4 | 33.35 |
| chr1: 54591500-54591650 | TCEANC2 | 47.78 |
| chr1: 54591500-54591650 | AL161915.1 | 47.78 |
| chr13: 114027400-114027550 | GRTP1 | 52.66 |
| chr13: 114027400-114027550 | DCUN1D2-AS | 52.66 |
| chr5: 139955080-139955230 | SNORA27 | 54.97 |
| chr5: 168133700-168133850 | MIR218-2 | 55.37 |
| chr4: 5461985-5462135 | STK32B | 61.7 |
| chr4: 5461985-5462135 | RN7SKP275 | 61.7 |
| chr11: 17743665-17743815 | OTOG | 62.53 |