SOM cluster: 2033
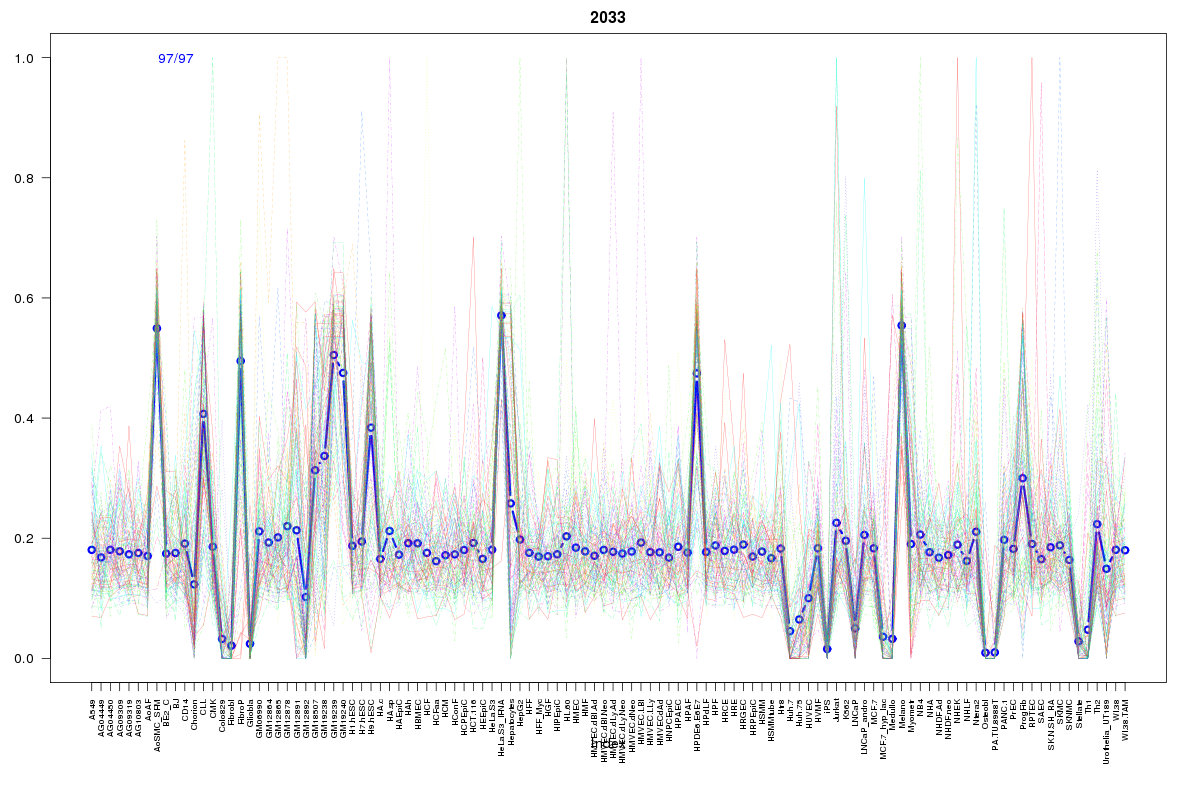
Cluster Hypersensitivity Profile

Genomic Location Trend
These plots show the distribution of the DHS sites surrounding the Transcript Start Site of the nearest gene.
Stats
Number of sites: 97Promoter: 1%
CpG-Island: 0%
Conserved: 28%
Enriched Motifs & Matches
Match Detail: [Jaspar]
|
| ||
|---|---|---|
| Sites: 11/97 | e-val: 0.001 | ||
| Factor | e-val(match) | DB |
| ARID3A | 0.0076478 | JASPAR |
| REST | 0.011494 | JASPAR |
| FEV | 0.018847 | JASPAR |
| NR2F1 | 0.018882 | JASPAR |
| Myf | 0.025676 | JASPAR |
|
| ||
| Sites: 37/97 | e-val: 0.48 | ||
| Factor | e-val(match) | DB |
| NKX3-1 | 0.0029336 | JASPAR |
| ARID3A | 0.0046233 | JASPAR |
| Foxd3 | 0.0053081 | JASPAR |
| MEF2A | 0.006286 | JASPAR |
| Lhx3 | 0.0084222 | JASPAR |
BED file downloads
Top 10 Example Regions
| Location | Gene Link | Dist. |
|---|---|---|
| chr11: 117787765-117787915 | RP11-728F11.4 | 78.72 |
| chr2: 178467700-178467850 | AGPS | 83.35 |
| chr4: 15968025-15968175 | FGFBP2 | 102.93 |
| chr7: 129796125-129796275 | SSMEM1 | 115.17 |
| chr6: 65948925-65949075 | EYS | 147.5 |