SOM cluster: 2049
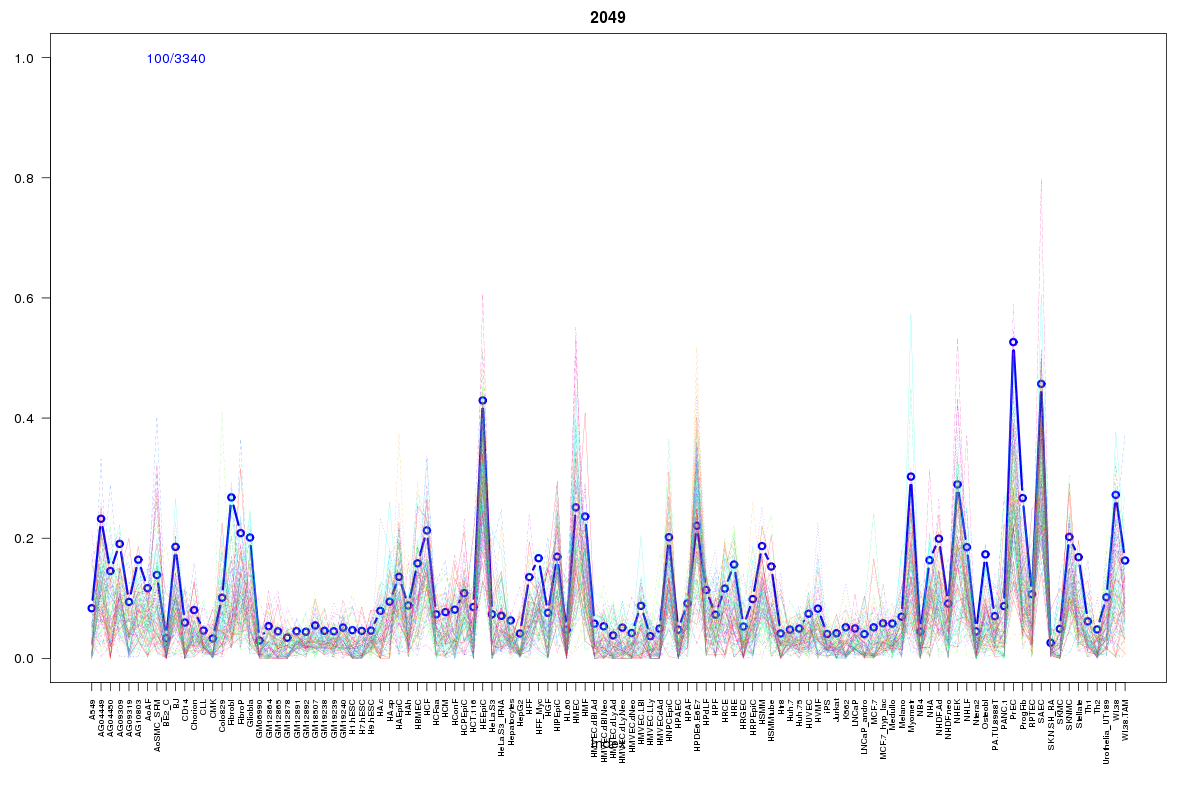
Cluster Hypersensitivity Profile

Genomic Location Trend
These plots show the distribution of the DHS sites surrounding the Transcript Start Site of the nearest gene.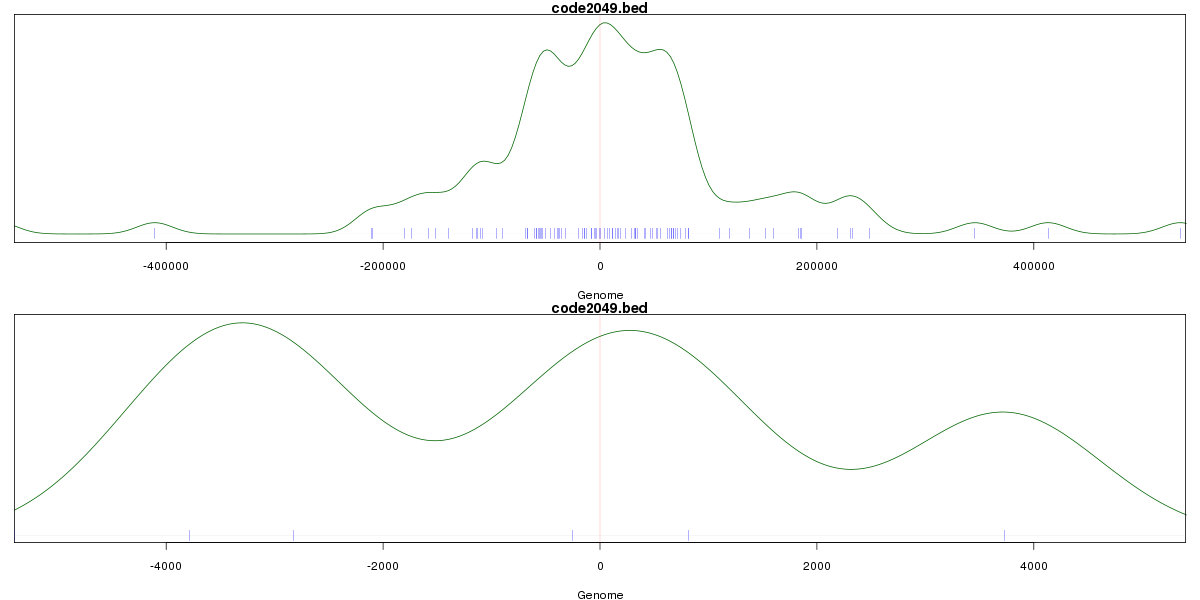
Stats
Number of sites: 3340Promoter: 1%
CpG-Island: 0%
Conserved: 16%
Enriched Motifs & Matches
Match Detail: [Jaspar]
|
| ||
|---|---|---|
| Sites: 25/100 | e-val: 0.038 | ||
| Factor | e-val(match) | DB |
| AP1 | 0.00000010214 | JASPAR |
| NFE2L2 | 0.00000082551 | JASPAR |
| NFE2L1::MafG | 0.00035689 | JASPAR |
| Pdx1 | 0.00092799 | JASPAR |
| Lhx3 | 0.0011258 | JASPAR |
BED file downloads
Top 10 Example Regions
| Location | Gene Link | Dist. |
|---|---|---|
| chr3: 37304420-37304570 | GOLGA4 | 25.43 |
| chr8: 101788100-101788250 | Y_RNA | 33.14 |
| chr18: 61550920-61551070 | SERPINB8 | 38.16 |
| chr18: 61550920-61551070 | HMSD | 38.16 |
| chr3: 8840560-8840710 | OXTR | 41.13 |
| chr8: 16129660-16129810 | RP11-447G11.1 | 42.71 |
| chr8: 101960140-101960290 | YWHAZ | 44.5 |
| chr1: 80850240-80850390 | RP11-339D23.1 | 46.89 |
| chr12: 27494020-27494170 | ARNTL2 | 47.19 |
| chr9: 104298780-104298930 | PPP3R2 | 47.66 |