SOM cluster: 2050
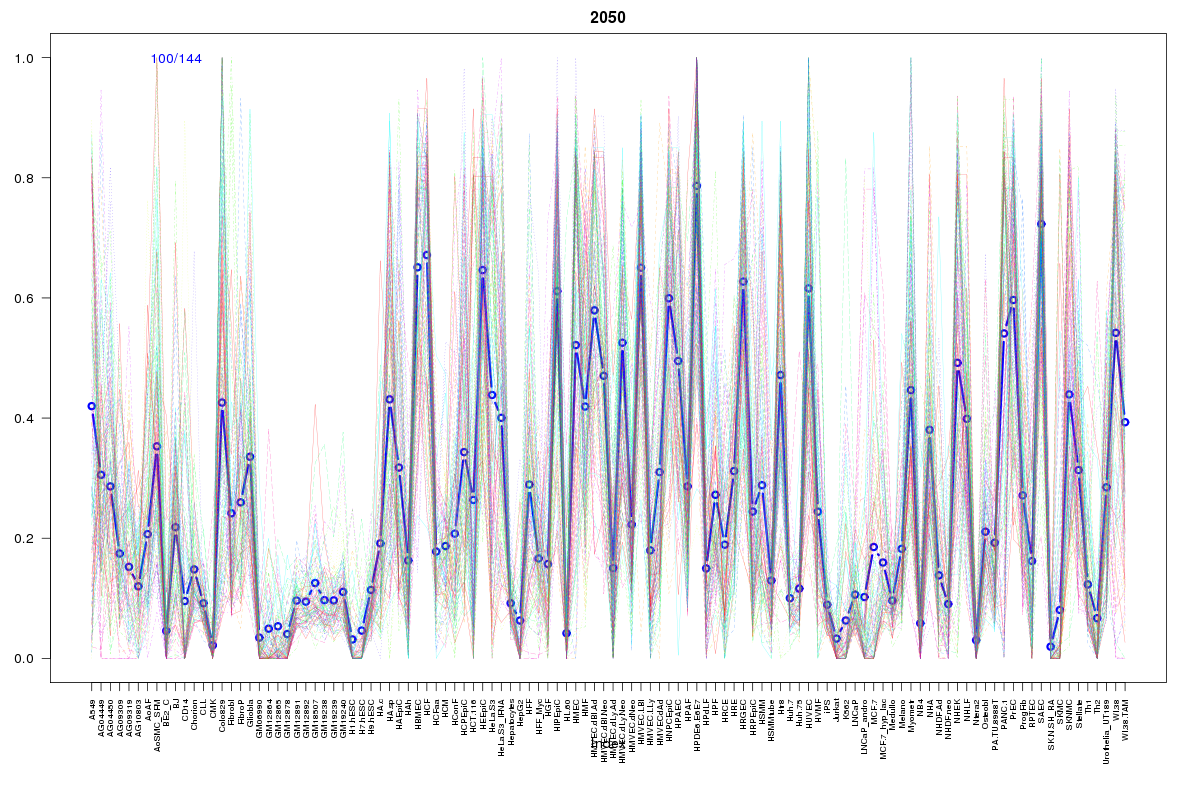
Cluster Hypersensitivity Profile

Genomic Location Trend
These plots show the distribution of the DHS sites surrounding the Transcript Start Site of the nearest gene.
Stats
Number of sites: 144Promoter: 2%
CpG-Island: 0%
Conserved: 35%
Enriched Motifs & Matches
Match Detail: [Jaspar]
|
| ||
|---|---|---|
| Sites: 59/100 | e-val: 3e-35 | ||
| Factor | e-val(match) | DB |
| AP1 | 0.00000000064966 | JASPAR |
| NFE2L2 | 0.000000005393 | JASPAR |
| NFE2L1::MafG | 0.00017986 | JASPAR |
| PBX1 | 0.0023567 | JASPAR |
| Pax2 | 0.021092 | JASPAR |
BED file downloads
Top 10 Example Regions
| Location | Gene Link | Dist. |
|---|---|---|
| chr12: 27329780-27329930 | C12orf71 | 34.56 |
| chr15: 80891740-80891890 | ABHD17C | 38.77 |
| chr6: 18344060-18344210 | Y_RNA | 46.73 |
| chr17: 27992260-27992410 | ANKRD13B | 51.22 |
| chr17: 27992260-27992410 | GIT1 | 51.22 |
| chr17: 68181020-68181170 | KCNJ2 | 53.83 |
| chr5: 42985700-42985850 | CTD-2325A15.3 | 55.55 |
| chr5: 42985700-42985850 | CTD-2201E18.3 | 55.55 |
| chr5: 42985700-42985850 | AC025171.1 | 55.55 |
| chr11: 9748320-9748470 | SWAP70 | 63.18 |