SOM cluster: 2091
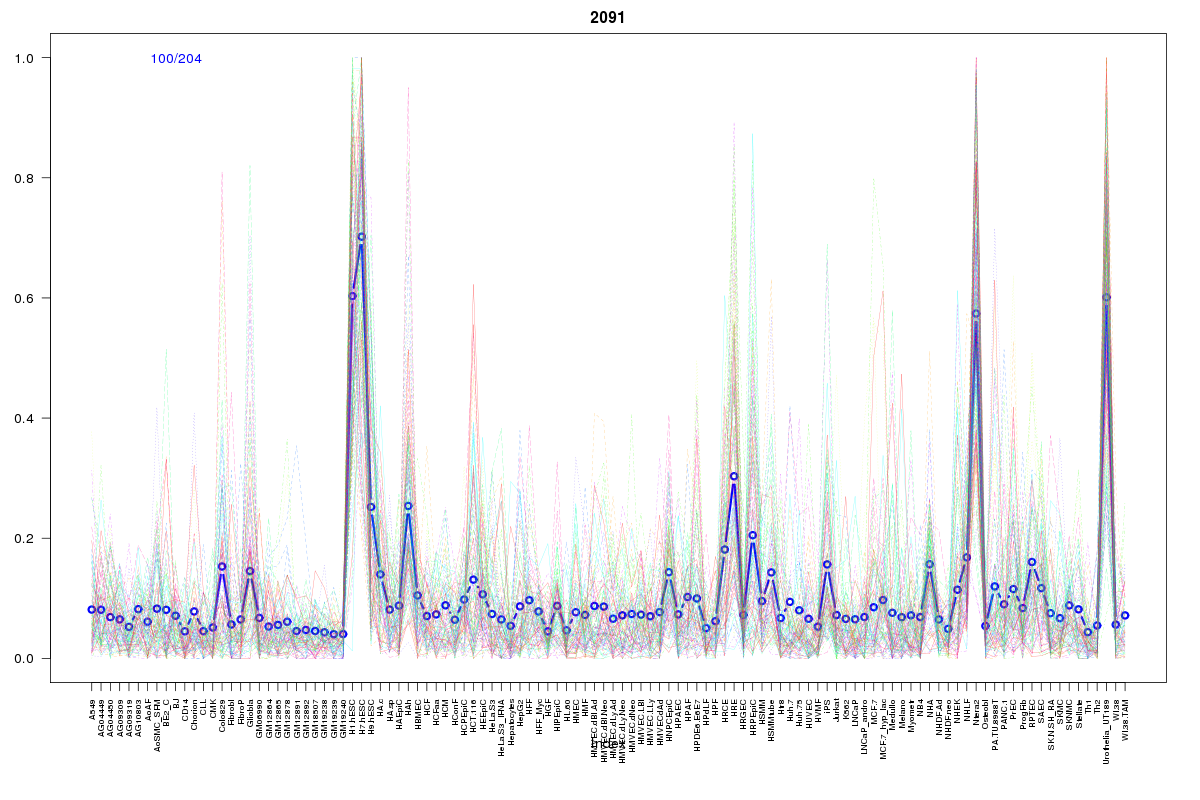
Cluster Hypersensitivity Profile

Genomic Location Trend
These plots show the distribution of the DHS sites surrounding the Transcript Start Site of the nearest gene.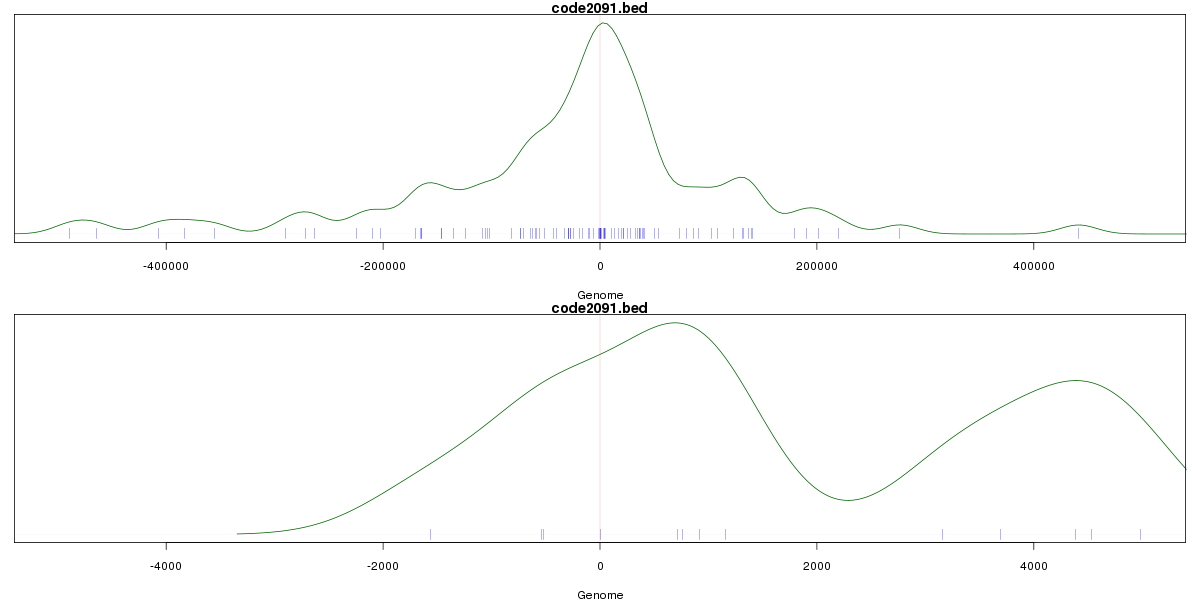
Stats
Number of sites: 204Promoter: 4%
CpG-Island: 4%
Conserved: 22%
Enriched Motifs & Matches
Match Detail: [Jaspar]
|
| ||
|---|---|---|
| Sites: 33/100 | e-val: 1.7e-17 | ||
| Factor | e-val(match) | DB |
| AP1 | 0.000000000025742 | JASPAR |
| NFE2L2 | 0.0000000068398 | JASPAR |
| PPARG | 0.0025385 | JASPAR |
| NFE2L1::MafG | 0.0047519 | JASPAR |
| RORA_2 | 0.013255 | JASPAR |
|
| ||
| Sites: 14/100 | e-val: 0.0097 | ||
| Factor | e-val(match) | DB |
| TEAD1 | 0.000081149 | JASPAR |
| znf143 | 0.0013927 | JASPAR |
| Stat3 | 0.001635 | JASPAR |
| RELA | 0.0020971 | JASPAR |
| EWSR1-FLI1 | 0.0027178 | JASPAR |
|
| ||
| Sites: 26/100 | e-val: 0.000038 | ||
| Factor | e-val(match) | DB |
| Tal1::Gata1 | 0.000031315 | JASPAR |
| EWSR1-FLI1 | 0.000089322 | JASPAR |
| SP1 | 0.00026663 | JASPAR |
| ZNF354C | 0.0042362 | JASPAR |
| ZEB1 | 0.0092788 | JASPAR |
BED file downloads
Top 10 Example Regions
| Location | Gene Link | Dist. |
|---|---|---|
| chr1: 151488840-151488990 | CGN | 50.75 |
| chr16: 11410225-11410375 | Y_RNA | 51.12 |
| chr12: 129460820-129460970 | TMEM132D | 52.53 |
| chr1: 57577940-57578090 | DAB1 | 55.17 |
| chr2: 47882000-47882150 | MSH2 | 59.9 |
| chrX: 105421180-105421330 | MUM1L1 | 61.33 |
| chr11: 20044505-20044655 | NAV2 | 68.48 |
| chr11: 20044505-20044655 | NAV2-AS2 | 68.48 |
| chrX: 102509120-102509270 | TCEAL8 | 70.69 |
| chrX: 102509120-102509270 | RP4-635G19.1 | 70.69 |