SOM cluster: 2095
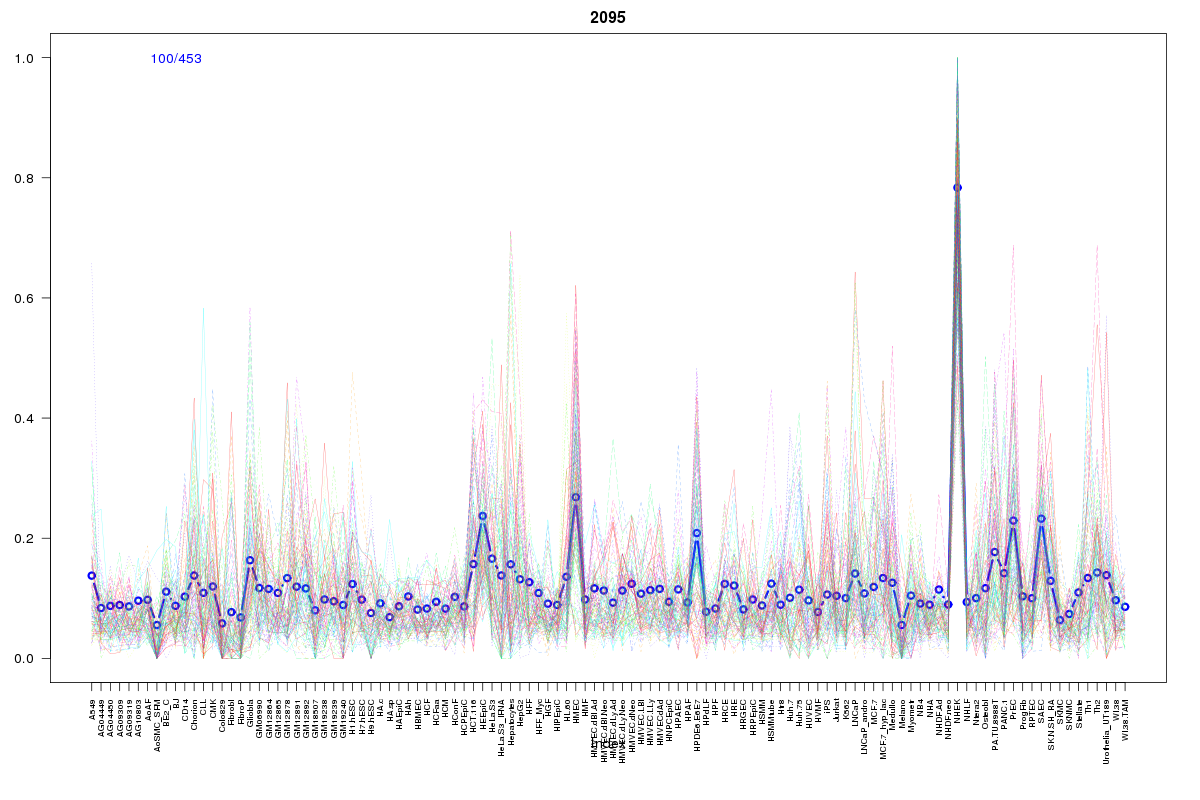
Cluster Hypersensitivity Profile

Genomic Location Trend
These plots show the distribution of the DHS sites surrounding the Transcript Start Site of the nearest gene.
Stats
Number of sites: 453Promoter: 18%
CpG-Island: 7%
Conserved: 46%
Enriched Motifs & Matches
Match Detail: [Jaspar]
|
| ||
|---|---|---|
| Sites: 57/100 | e-val: 0.0000000000000013 | ||
| Factor | e-val(match) | DB |
| Klf4 | 0.00000029253 | JASPAR |
| SP1 | 0.0000065514 | JASPAR |
| RREB1 | 0.000071827 | JASPAR |
| Pax4 | 0.00044235 | JASPAR |
| MZF1_1-4 | 0.019576 | JASPAR |
BED file downloads
Top 10 Example Regions
| Location | Gene Link | Dist. |
|---|---|---|
| chr19: 10665985-10666135 | AP1M2 | 32.48 |
| chr19: 10665985-10666135 | ATG4D | 32.48 |
| chr19: 10665985-10666135 | S1PR5 | 32.48 |
| chr12: 28124025-28124175 | PTHLH | 33.7 |
| chr12: 28124025-28124175 | RP11-993B23.3 | 33.7 |
| chr8: 145007440-145007590 | GRINA | 39.64 |
| chr1: 183248645-183248795 | LAMC2 | 39.7 |
| chr8: 22458345-22458495 | PDLIM2 | 40.21 |
| chr8: 22458345-22458495 | C8orf58 | 40.21 |
| chr8: 22458345-22458495 | AC037459.4 | 40.21 |