SOM cluster: 2101
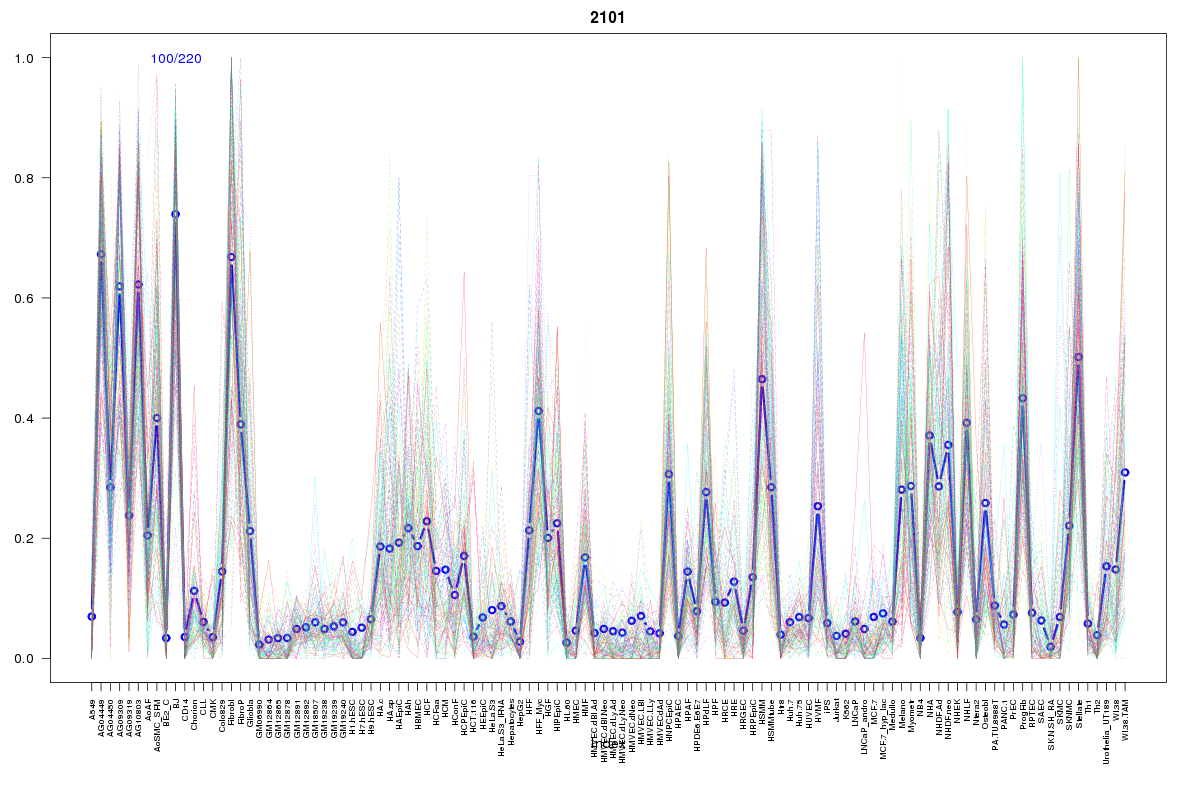
Cluster Hypersensitivity Profile

Genomic Location Trend
These plots show the distribution of the DHS sites surrounding the Transcript Start Site of the nearest gene.
Stats
Number of sites: 220Promoter: 0%
CpG-Island: 0%
Conserved: 32%
Enriched Motifs & Matches
Match Detail: [Jaspar]
|
| ||
|---|---|---|
| Sites: 36/100 | e-val: 0.000000067 | ||
| Factor | e-val(match) | DB |
| Foxd3 | 0.00040021 | JASPAR |
| Pax4 | 0.0010013 | JASPAR |
| Foxq1 | 0.0016897 | JASPAR |
| HNF1A | 0.0024734 | JASPAR |
| Lhx3 | 0.0025321 | JASPAR |
BED file downloads
Top 10 Example Regions
| Location | Gene Link | Dist. |
|---|---|---|
| chr14: 64121140-64121290 | WDR89 | 38.81 |
| chr3: 29863680-29863830 | RBMS3 | 51.41 |
| chr1: 92002805-92002955 | CDC7 | 53.09 |
| chr2: 120018320-120018470 | C2orf76 | 59.98 |
| chr6: 36399980-36400130 | STK38 | 60.65 |
| chr6: 36399980-36400130 | RN7SL748P | 60.65 |
| chr6: 36399980-36400130 | KCTD20 | 60.65 |
| chr1: 16577200-16577350 | MT1XP1 | 61.33 |
| chr13: 114280560-114280710 | TFDP1 | 61.74 |
| chr13: 114280560-114280710 | TMCO3 | 61.74 |