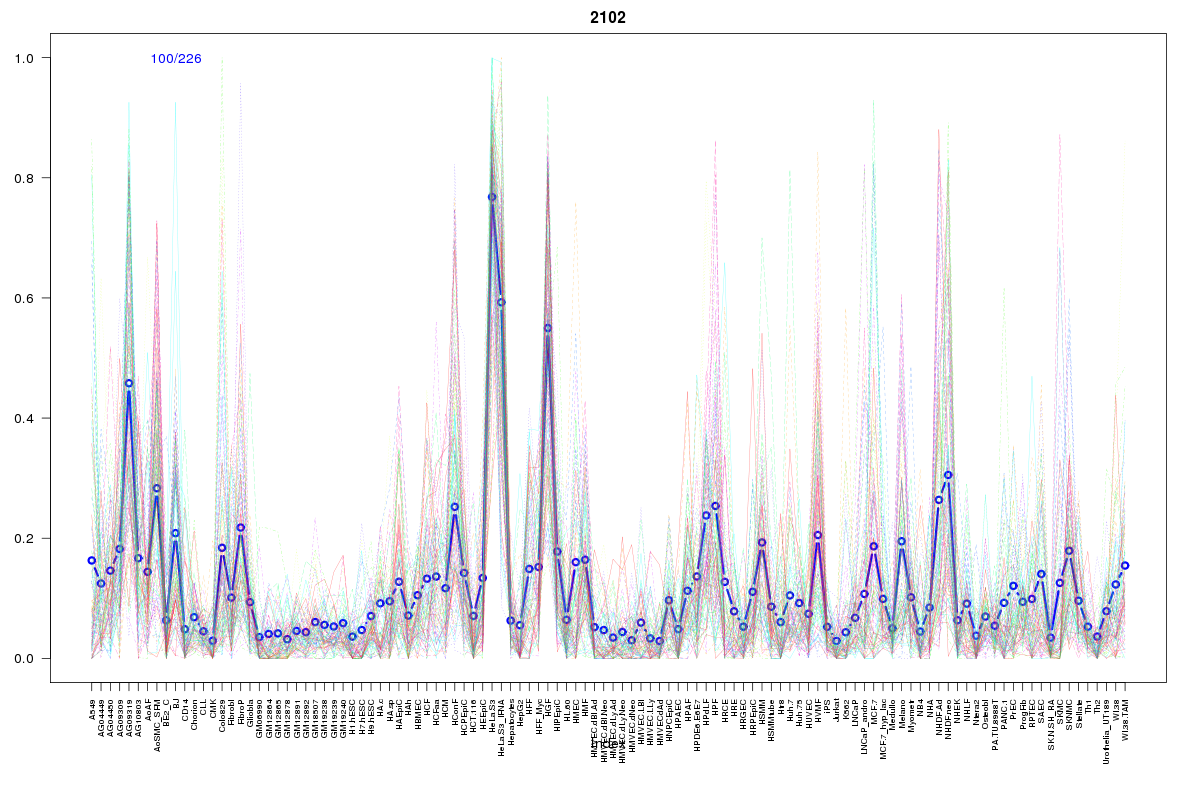
SOM cluster: 2102
Cluster Hypersensitivity Profile

Genomic Location Trend
These plots show the distribution of the DHS sites surrounding the Transcript Start Site of the nearest gene.
Stats
Number of sites: 226Promoter: 3%
CpG-Island: 0%
Conserved: 36%
Enriched Motifs & Matches
Match Detail: [Jaspar]
|
| ||
|---|---|---|
| Sites: 31/100 | e-val: 0.0000033 | ||
| Factor | e-val(match) | DB |
| Foxd3 | 0.00017595 | JASPAR |
| Foxq1 | 0.00021 | JASPAR |
| Pou5f1 | 0.005334 | JASPAR |
| Pax4 | 0.0055771 | JASPAR |
| HNF1A | 0.0086068 | JASPAR |
BED file downloads
Top 10 Example Regions
| Location | Gene Link | Dist. |
|---|---|---|
| chr6: 1338200-1338350 | FOXF2 | 46.94 |
| chr5: 143206600-143206750 | CTB-70D19.1 | 60.25 |
| chr8: 12583820-12583970 | OR7E15P | 63.11 |
| chr1: 56293860-56294010 | RP11-90C4.2 | 64.49 |
| chr8: 82470220-82470370 | FTH1P11 | 65.35 |
| chr11: 65059165-65059315 | CDC42EP2 | 69.45 |
| chr18: 21975140-21975290 | OSBPL1A | 69.57 |
| chr18: 21975140-21975290 | IMPACT | 69.57 |
| chr5: 93807380-93807530 | KIAA0825 | 71.03 |
| chr5: 38465340-38465490 | LIFR-AS1 | 72.34 |