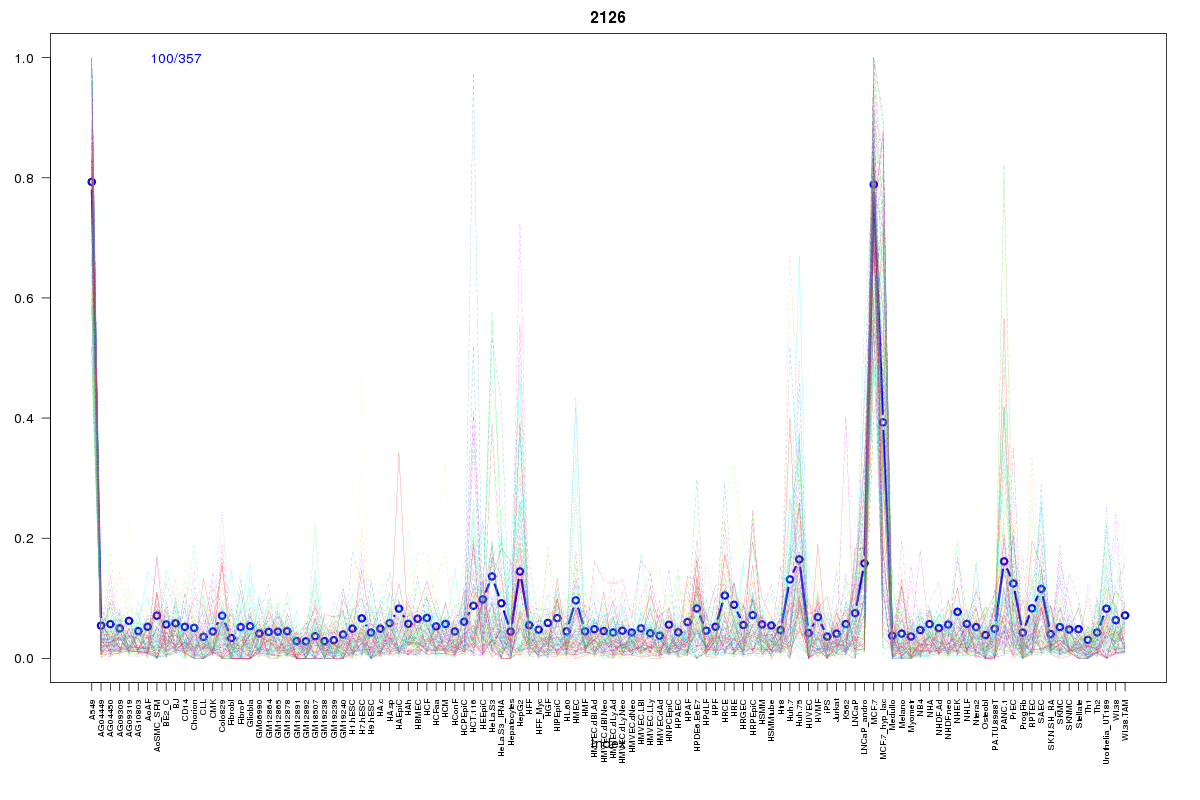
SOM cluster: 2126
Cluster Hypersensitivity Profile

Genomic Location Trend
These plots show the distribution of the DHS sites surrounding the Transcript Start Site of the nearest gene.
Stats
Number of sites: 357Promoter: 0%
CpG-Island: 0%
Conserved: 25%
Enriched Motifs & Matches
Match Detail: [Jaspar]
|
| ||
|---|---|---|
| Sites: 21/100 | e-val: 0.12 | ||
| Factor | e-val(match) | DB |
| HNF1B | 0.00000059478 | JASPAR |
| HNF1A | 0.00010463 | JASPAR |
| Foxd3 | 0.00031096 | JASPAR |
| FOXA1 | 0.00070653 | JASPAR |
| Foxq1 | 0.0010538 | JASPAR |
BED file downloads
Top 10 Example Regions
| Location | Gene Link | Dist. |
|---|---|---|
| chr17: 48770005-48770155 | ANKRD40 | 55.98 |
| chr19: 33487980-33488130 | RHPN2 | 56.2 |
| chr2: 164634560-164634710 | FIGN | 62.65 |
| chr20: 10231825-10231975 | RP11-416N4.1 | 65.42 |
| chr17: 47184040-47184190 | IGF2BP1 | 68.07 |
| chr14: 63971325-63971475 | PPP2R5E | 69.49 |
| chr10: 54232085-54232235 | RP11-346D6.6 | 76.7 |
| chr4: 40451020-40451170 | RBM47 | 77.81 |
| chr7: 107992240-107992390 | NRCAM | 79.73 |
| chr17: 60188580-60188730 | MED13 | 81.52 |