SOM cluster: 2130
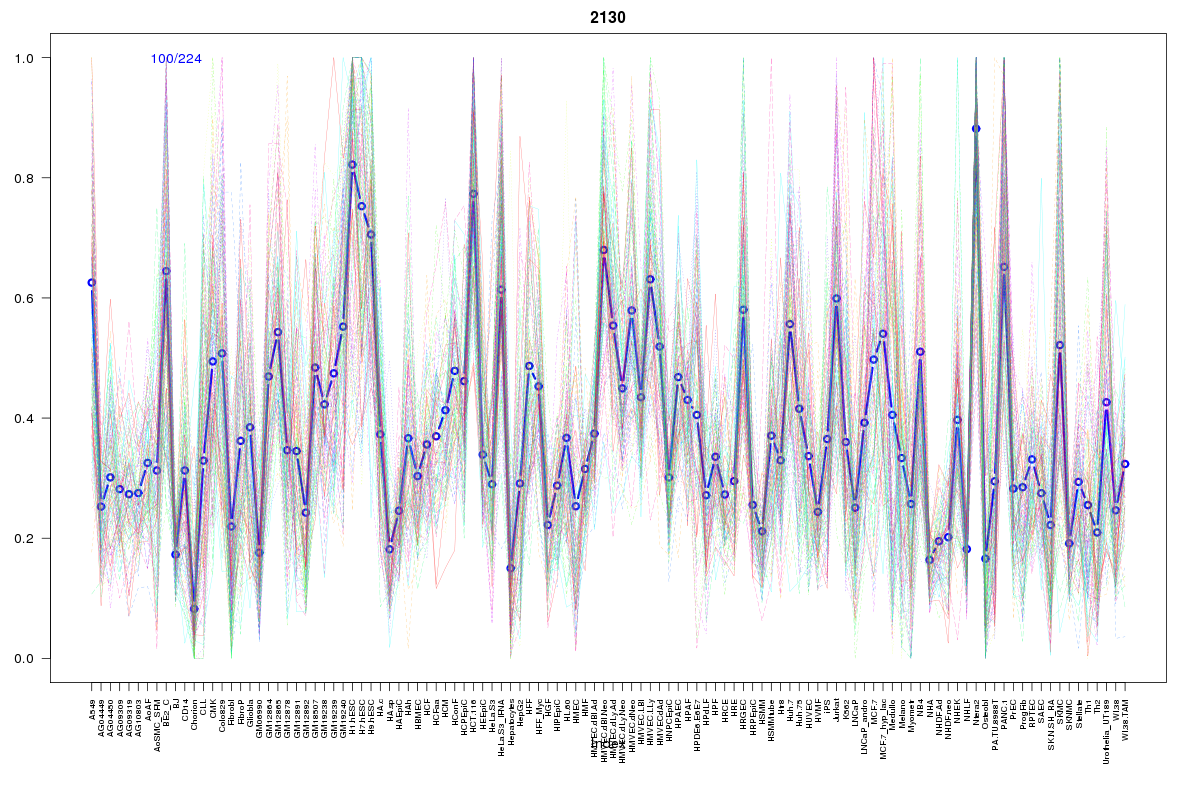
Cluster Hypersensitivity Profile

Genomic Location Trend
These plots show the distribution of the DHS sites surrounding the Transcript Start Site of the nearest gene.
Stats
Number of sites: 224Promoter: 1%
CpG-Island: 0%
Conserved: 60%
Enriched Motifs & Matches
Match Detail: [Jaspar]
|
| ||
|---|---|---|
| Sites: 74/100 | e-val: 0 | ||
| Factor | e-val(match) | DB |
| CTCF | 0.0000000000000067724 | JASPAR |
| INSM1 | 0.0000011309 | JASPAR |
| Zfp423 | 0.0019138 | JASPAR |
| PLAG1 | 0.0086697 | JASPAR |
| MYC::MAX | 0.011482 | JASPAR |
BED file downloads
Top 10 Example Regions
| Location | Gene Link | Dist. |
|---|---|---|
| chr1: 147113940-147114090 | BCL9 | 20.25 |
| chrX: 136036380-136036530 | RBMX | 53.67 |
| chr3: 140719020-140719170 | SLC25A36 | 53.96 |
| chr3: 140719020-140719170 | SPSB4 | 53.96 |
| chr3: 129543900-129544050 | AC083799.1 | 55.12 |
| chr3: 129543900-129544050 | RNU6-1142P | 55.12 |
| chr3: 129543900-129544050 | TMCC1 | 55.12 |
| chr11: 82486920-82487070 | PRCP | 58 |
| chr1: 156767160-156767310 | PRCC | 63.04 |
| chr1: 156767160-156767310 | ISG20L2 | 63.04 |