SOM cluster: 217
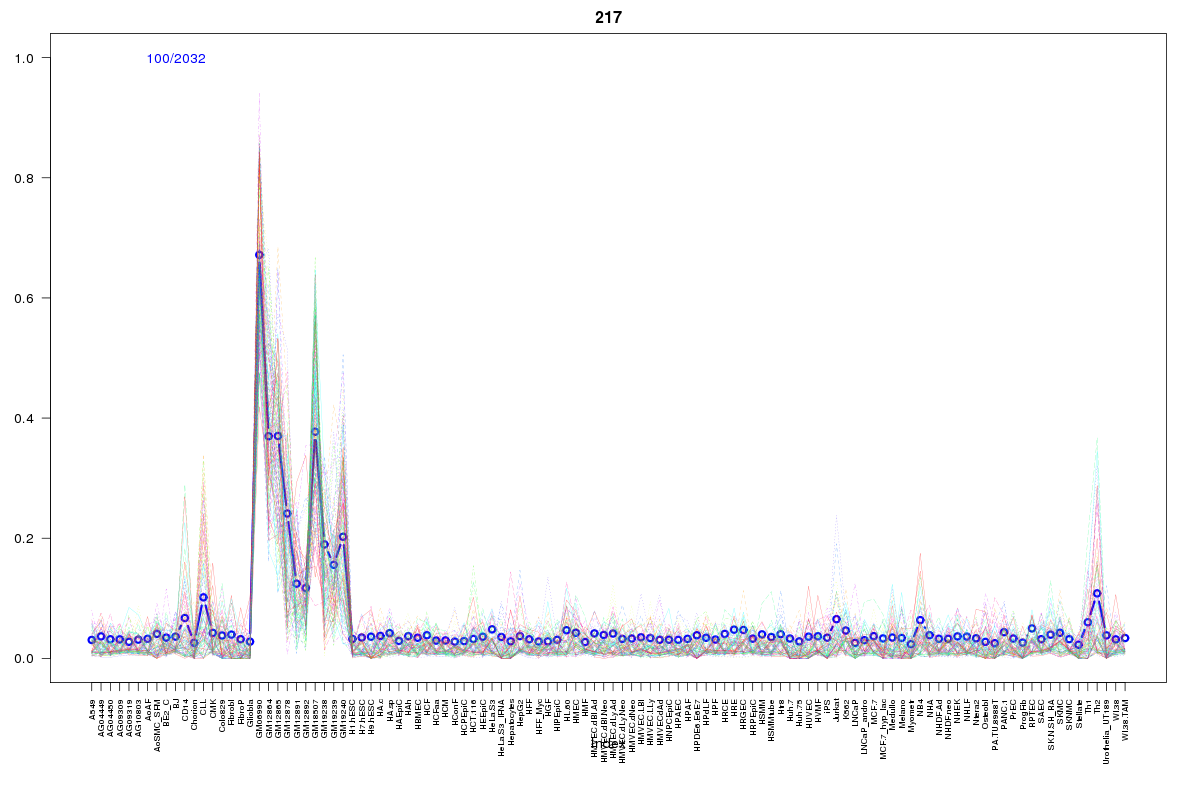
Cluster Hypersensitivity Profile

Genomic Location Trend
These plots show the distribution of the DHS sites surrounding the Transcript Start Site of the nearest gene.
Stats
Number of sites: 2032Promoter: 1%
CpG-Island: 0%
Conserved: 17%
Enriched Motifs & Matches
Match Detail: [Jaspar]
|
| ||
|---|---|---|
| Sites: 49/100 | e-val: 0.000000000013 | ||
| Factor | e-val(match) | DB |
| Foxd3 | 0.000015286 | JASPAR |
| Lhx3 | 0.00010257 | JASPAR |
| Foxq1 | 0.00015875 | JASPAR |
| FOXI1 | 0.0047458 | JASPAR |
| HNF1A | 0.0054559 | JASPAR |
BED file downloads
Top 10 Example Regions
| Location | Gene Link | Dist. |
|---|---|---|
| chr19: 38465900-38466050 | SIPA1L3 | 27.89 |
| chr1: 183559360-183559510 | NCF2 | 33.64 |
| chr1: 183559360-183559510 | ARPC5 | 33.64 |
| chr7: 150105765-150105915 | RP4-584D14.5 | 35.12 |
| chr7: 150105765-150105915 | LINC00996 | 35.12 |
| chr8: 37761205-37761355 | RAB11FIP1 | 40.45 |
| chr8: 37761205-37761355 | GPR124 | 40.45 |
| chr22: 37318000-37318150 | NCF4 | 41.67 |
| chr22: 37318000-37318150 | CSF2RB | 41.67 |
| chr1: 160767340-160767490 | SLAMF7 | 42.47 |